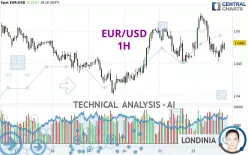
EUR/USD - 1H - Technical analysis published on 02/24/2025 (GMT)
- 254
- 0
- Timeframe : 1H
- - Analysis generated on
- Status : NEUTRAL

Summary of the analysis

Additional analysis
Quotes
The EUR/USD price is 1.0482 USD. The price has increased by +0.21% since the last closing with the lowest point at 1.0453 USD and the highest point at 1.0528 USD. The deviation from the price is +0.28% for the low point and -0.44% for the high point.A bullish opening was detected by the Central Gaps scanner. Buyers are trying to impose a bullish momentum in the very short term.
Bullish opening
Type : Bullish
Timeframe : Openning
A study of price movements over other periods shows the following variations:
Near a new LOW record (1 year)
Type : Bearish
Timeframe : Weekly
Near a new LOW record (1st january)
Type : Bearish
Timeframe : Weekly
Near a new LOW record (1 month)
Type : Bearish
Timeframe : Weekly
Technical
Technical analysis of this 1H chart of EUR/USD indicates that the overall trend is slightly bullish. 60.71% of the signals given by moving averages are bullish. As the signals currently given by short-term moving averages are rather neutral, the overall trend could quickly return to neutral as well. The Central Indicators market scanner is currently detecting several bearish and bullish signals that could impact this trend:
Bearish trend reversal : Moving Average 20
Type : Bearish
Timeframe : 1 hour
Bearish trend reversal : Moving Average 50
Type : Bearish
Timeframe : 1 hour
Bullish price crossover with adaptative moving average 50
Type : Bullish
Timeframe : 1 hour
On the 18 technical indicators analysed, 6 are bullish, 5 are neutral and 7 are bearish. Caution: the Central Indicators scanner currently detects an excess:
MACD indicator: bullish divergence
Type : Bullish
Timeframe : 1 hour
Parabolic SAR indicator bullish reversal
Type : Bullish
Timeframe : 1 hour
Central Patterns, the market scanner focusing on chart patterns, resistances and supports found these results:
Near horizontal resistance
Type : Bearish
Timeframe : 1 hour
Resistance of channel is broken
Type : Bullish
Timeframe : 1 hour
The Central Candlesticks scanner currently notes the presence of this pattern in Japanese candlesticks that could mark the end of the short-term trend currently underway:
Doji
Type : Neutral
Timeframe : 1 hour
| S3 | S2 | S1 | Price | R1 | R2 | R3 | |
|---|---|---|---|---|---|---|---|
| ProTrendLines | 1.0430 | 1.0448 | 1.0470 | 1.0482 | 1.0485 | 1.0506 | 1.0693 |
| Change (%) | -0.50% | -0.32% | -0.11% | - | +0.03% | +0.23% | +2.01% |
| Change | -0.0052 | -0.0034 | -0.0012 | - | +0.0003 | +0.0024 | +0.0211 |
| Level | Major | Minor | Minor | - | Minor | Intermediate | Intermediate |
Attention could also be paid to pivot points to set price objectives:
| Pivot points | S3 | S2 | S1 | PP | R1 | R2 | R3 |
|---|---|---|---|---|---|---|---|
| Standard | 1.0382 | 1.0415 | 1.0438 | 1.0471 | 1.0494 | 1.0527 | 1.0550 |
| Camarilla | 1.0445 | 1.0450 | 1.0455 | 1.0460 | 1.0465 | 1.0470 | 1.0475 |
| Woodie | 1.0376 | 1.0413 | 1.0432 | 1.0469 | 1.0488 | 1.0525 | 1.0544 |
| Fibonacci | 1.0415 | 1.0437 | 1.0450 | 1.0471 | 1.0493 | 1.0506 | 1.0527 |
| Pivot points | S3 | S2 | S1 | PP | R1 | R2 | R3 |
|---|---|---|---|---|---|---|---|
| Standard | 1.0299 | 1.0350 | 1.0405 | 1.0456 | 1.0511 | 1.0562 | 1.0617 |
| Camarilla | 1.0431 | 1.0441 | 1.0450 | 1.0460 | 1.0470 | 1.0479 | 1.0489 |
| Woodie | 1.0301 | 1.0351 | 1.0407 | 1.0457 | 1.0513 | 1.0563 | 1.0619 |
| Fibonacci | 1.0350 | 1.0391 | 1.0416 | 1.0456 | 1.0497 | 1.0522 | 1.0562 |
| Pivot points | S3 | S2 | S1 | PP | R1 | R2 | R3 |
|---|---|---|---|---|---|---|---|
| Standard | 0.9829 | 1.0004 | 1.0184 | 1.0359 | 1.0539 | 1.0714 | 1.0894 |
| Camarilla | 1.0267 | 1.0300 | 1.0333 | 1.0365 | 1.0398 | 1.0430 | 1.0463 |
| Woodie | 0.9833 | 1.0005 | 1.0188 | 1.0360 | 1.0543 | 1.0715 | 1.0898 |
| Fibonacci | 1.0004 | 1.0139 | 1.0223 | 1.0359 | 1.0494 | 1.0578 | 1.0714 |
Numerical data
The following is the status of the technical indicators and moving averages at the time of publication of this technical analysis:
| RSI (14): | 46.51 | |
| MACD (12,26,9): | -0.0003 | |
| Directional Movement: | -2.8969 | |
| AROON (14): | -71.4286 | |
| DEMA (21): | 1.0476 | |
| Parabolic SAR (0,02-0,02-0,2): | 1.0454 | |
| Elder Ray (13): | -0.0005 | |
| Super Trend (3,10): | 1.0509 | |
| Zig ZAG (10): | 1.0473 | |
| VORTEX (21): | 1.0000 | |
| Stochastique (14,3,5): | 30.67 | |
| TEMA (21): | 1.0470 | |
| Williams %R (14): | -71.64 | |
| Chande Momentum Oscillator (20): | -0.0037 | |
| Repulse (5,40,3): | -0.0018 | |
| ROCnROLL: | 2 | |
| TRIX (15,9): | -0.0007 | |
| Courbe Coppock: | 0.68 |
| MA7: | 1.0468 | |
| MA20: | 1.0411 | |
| MA50: | 1.0389 | |
| MA100: | 1.0547 | |
| MAexp7: | 1.0473 | |
| MAexp20: | 1.0478 | |
| MAexp50: | 1.0476 | |
| MAexp100: | 1.0467 | |
| Price / MA7: | +0.13% | |
| Price / MA20: | +0.68% | |
| Price / MA50: | +0.90% | |
| Price / MA100: | -0.62% | |
| Price / MAexp7: | +0.09% | |
| Price / MAexp20: | +0.04% | |
| Price / MAexp50: | +0.06% | |
| Price / MAexp100: | +0.14% |
News
The latest news and videos published on EUR/USD at the time of the analysis were as follows:
-
 EUR/USD Analysis: Are We at the Top?
-
EUR/USD Long Position Success & USD/JPY Short Setup | Trade of the Week February 2025
-
EUR/USD trading strategy: how Trump's tariffs changed everything | Trade of the Week February 2025
-
EUR/USD Analysis: Can the Euro Continue to Rise?
-
Technical Outlook on EURUSD, USDJPY, GBPUSD
About author

Online


Add a comment
Comments
0 comments on the analysis EUR/USD - 1H