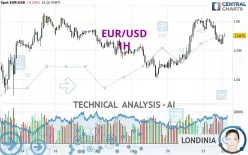
EUR/USD - 1H - Technical analysis published on 02/21/2025 (GMT)
- 61
- 0
- Timeframe : 1H
- - Analysis generated on
- Status : IN PROGRESS...

Summary of the analysis

Additional analysis
Quotes
The EUR/USD rating is 1.0475 USD. The price is lower by -0.24% since the last closing and was between 1.0459 USD and 1.0505 USD. This implies that the price is at +0.15% from its lowest and at -0.29% from its highest.So that you have an overall view of the price change, here is a table showing the variations over several periods:
Near a new LOW record (1 year)
Type : Bearish
Timeframe : Weekly
Near a new LOW record (1st january)
Type : Bearish
Timeframe : Weekly
Near a new LOW record (1 month)
Type : Bearish
Timeframe : Weekly
Technical
A technical analysis in 1H of this EUR/USD chart shows a bullish trend. 67.86% of the signals given by moving averages are bullish. Caution: the neutral signals currently given by short-term moving averages show us that the global trend is losing momentum. There is no crossing of moving average by the price or crossing of moving averages between themselves.
In fact, Central Analyzer took into account 18 technical indicators and the result was as follows: 4 are bullish, 7 are neutral and 7 are bearish. Caution: the Central Indicators scanner currently detects an excess:
CCI indicator is oversold : under -100
Type : Neutral
Timeframe : 1 hour
Previous candle closed under Bollinger bands
Type : Neutral
Timeframe : 1 hour
RSI indicator is back over 50
Type : Bullish
Timeframe : 1 hour
The Central Patterns scanner, which studies chart patterns, resistances and supports, has identified this signal:
Near support of channel
Type : Bullish
Timeframe : 1 hour
The Central Candlesticks scanner which studies Japanese candlesticks did not detect anything.
| S3 | S2 | S1 | Price | R1 | R2 | R3 | |
|---|---|---|---|---|---|---|---|
| ProTrendLines | 1.0401 | 1.0430 | 1.0470 | 1.0475 | 1.0514 | 1.0693 | 1.0783 |
| Change (%) | -0.71% | -0.43% | -0.05% | - | +0.37% | +2.08% | +2.94% |
| Change | -0.0074 | -0.0045 | -0.0005 | - | +0.0039 | +0.0218 | +0.0308 |
| Level | Intermediate | Major | Intermediate | - | Intermediate | Major | Minor |
To determine price objectives, it is also possible to use the pivot points. Here is the price position in relation to pivot points:
| Pivot points | S3 | S2 | S1 | PP | R1 | R2 | R3 |
|---|---|---|---|---|---|---|---|
| Standard | 1.0355 | 1.0387 | 1.0443 | 1.0475 | 1.0531 | 1.0563 | 1.0619 |
| Camarilla | 1.0476 | 1.0484 | 1.0492 | 1.0500 | 1.0508 | 1.0516 | 1.0524 |
| Woodie | 1.0368 | 1.0393 | 1.0456 | 1.0481 | 1.0544 | 1.0569 | 1.0632 |
| Fibonacci | 1.0387 | 1.0420 | 1.0441 | 1.0475 | 1.0508 | 1.0529 | 1.0563 |
| Pivot points | S3 | S2 | S1 | PP | R1 | R2 | R3 |
|---|---|---|---|---|---|---|---|
| Standard | 1.0105 | 1.0192 | 1.0341 | 1.0428 | 1.0577 | 1.0664 | 1.0813 |
| Camarilla | 1.0426 | 1.0448 | 1.0469 | 1.0491 | 1.0513 | 1.0534 | 1.0556 |
| Woodie | 1.0137 | 1.0208 | 1.0373 | 1.0444 | 1.0609 | 1.0680 | 1.0845 |
| Fibonacci | 1.0192 | 1.0282 | 1.0338 | 1.0428 | 1.0518 | 1.0574 | 1.0664 |
| Pivot points | S3 | S2 | S1 | PP | R1 | R2 | R3 |
|---|---|---|---|---|---|---|---|
| Standard | 0.9829 | 1.0004 | 1.0184 | 1.0359 | 1.0539 | 1.0714 | 1.0894 |
| Camarilla | 1.0267 | 1.0300 | 1.0333 | 1.0365 | 1.0398 | 1.0430 | 1.0463 |
| Woodie | 0.9833 | 1.0005 | 1.0188 | 1.0360 | 1.0543 | 1.0715 | 1.0898 |
| Fibonacci | 1.0004 | 1.0139 | 1.0223 | 1.0359 | 1.0494 | 1.0578 | 1.0714 |
Numerical data
The following are the details of the technical indicators and moving averages that were collected to generate this technical analysis:
| RSI (14): | 50.75 | |
| MACD (12,26,9): | 0.0002 | |
| Directional Movement: | -0.1955 | |
| AROON (14): | -92.8571 | |
| DEMA (21): | 1.0483 | |
| Parabolic SAR (0,02-0,02-0,2): | 1.0494 | |
| Elder Ray (13): | -0.0009 | |
| Super Trend (3,10): | 1.0501 | |
| Zig ZAG (10): | 1.0476 | |
| VORTEX (21): | 0.9878 | |
| Stochastique (14,3,5): | 18.39 | |
| TEMA (21): | 1.0477 | |
| Williams %R (14): | -65.22 | |
| Chande Momentum Oscillator (20): | -0.0010 | |
| Repulse (5,40,3): | 0.0371 | |
| ROCnROLL: | -1 | |
| TRIX (15,9): | 0.0119 | |
| Courbe Coppock: | 0.44 |
| MA7: | 1.0469 | |
| MA20: | 1.0410 | |
| MA50: | 1.0390 | |
| MA100: | 1.0553 | |
| MAexp7: | 1.0474 | |
| MAexp20: | 1.0477 | |
| MAexp50: | 1.0467 | |
| MAexp100: | 1.0457 | |
| Price / MA7: | +0.06% | |
| Price / MA20: | +0.62% | |
| Price / MA50: | +0.82% | |
| Price / MA100: | -0.74% | |
| Price / MAexp7: | +0.01% | |
| Price / MAexp20: | -0.02% | |
| Price / MAexp50: | +0.08% | |
| Price / MAexp100: | +0.17% |
News
Don't forget to follow the news on EUR/USD. At the time of publication of this analysis, the latest news was as follows:
-
 EUR/USD Analysis: Are We at the Top?
-
EUR/USD Long Position Success & USD/JPY Short Setup | Trade of the Week February 2025
-
EUR/USD trading strategy: how Trump's tariffs changed everything | Trade of the Week February 2025
-
EUR/USD Analysis: Can the Euro Continue to Rise?
-
Technical Outlook on EURUSD, USDJPY, GBPUSD
About author

Online


Add a comment
Comments
0 comments on the analysis EUR/USD - 1H