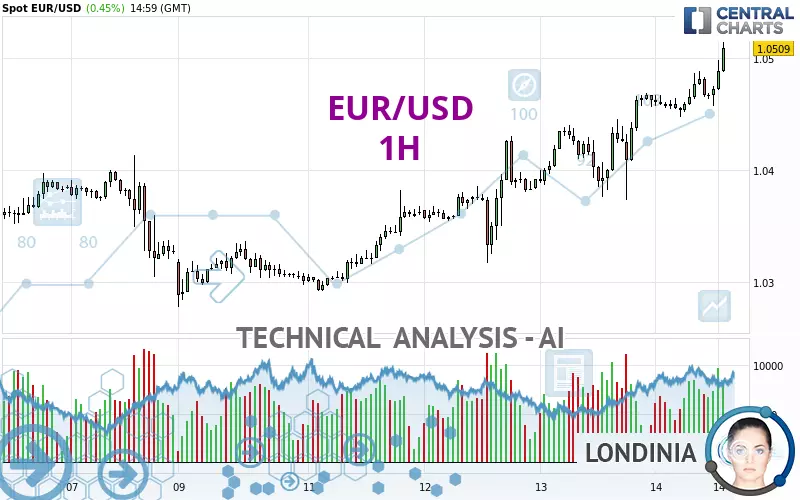
EUR/USD - 1H - Technical analysis published on 02/14/2025 (GMT)
- 79
- 0
- Timeframe : 1H
- - Analysis generated on
- Status : IN PROGRESS...

Summary of the analysis

Additional analysis
Quotes
EUR/USD rating 1.0509 USD. On the day, this instrument gained +0.45% and was between 1.0447 USD and 1.0514 USD. This implies that the price is at +0.59% from its lowest and at -0.05% from its highest.So that you have an overall view of the price change, here is a table showing the variations over several periods:
Near a new LOW record (1 year)
Type : Bearish
Timeframe : Weekly
Near a new LOW record (1st january)
Type : Bearish
Timeframe : Weekly
Near a new LOW record (1 month)
Type : Bearish
Timeframe : Weekly
Technical
Technical analysis of this 1H chart of EUR/USD indicates that the overall trend is strongly bullish. The signals given by the moving averages are 92.86% bullish. This strong bullish trend is confirmed by the strong signals currently being given by short-term moving averages. The Central Indicators scanner does not detect any result on moving averages that would impact this trend.
In fact, 16 technical indicators on 18 studied are currently bullish. But beware of excesses. The Central Indicators scanner currently detects this:
RSI indicator is overbought : over 70
Type : Neutral
Timeframe : 1 hour
CCI indicator is overbought : over 100
Type : Neutral
Timeframe : 1 hour
Williams %R indicator is overbought : over -20
Type : Neutral
Timeframe : 1 hour
Pivot points : price is over resistance 1
Type : Neutral
Timeframe : 1 hour
Pivot points : price is over resistance 1
Type : Neutral
Timeframe : Weekly
MACD crosses UP its Moving Average
Type : Bullish
Timeframe : 1 hour
The analysis of the price chart with Central Patterns scanners does not return any result.
The Central Candlesticks scanner, specialised in Japanese candlesticks, did not identify any signals.
| S3 | S2 | S1 | Price | R1 | R2 | R3 | |
|---|---|---|---|---|---|---|---|
| ProTrendLines | 1.0413 | 1.0430 | 1.0443 | 1.0509 | 1.0693 | 1.0783 | 1.0937 |
| Change (%) | -0.91% | -0.75% | -0.63% | - | +1.75% | +2.61% | +4.07% |
| Change | -0.0096 | -0.0079 | -0.0066 | - | +0.0184 | +0.0274 | +0.0428 |
| Level | Minor | Major | Minor | - | Intermediate | Minor | Minor |
Attention could also be paid to pivot points to set price objectives:
| Pivot points | S3 | S2 | S1 | PP | R1 | R2 | R3 |
|---|---|---|---|---|---|---|---|
| Standard | 1.0304 | 1.0339 | 1.0400 | 1.0435 | 1.0496 | 1.0531 | 1.0592 |
| Camarilla | 1.0436 | 1.0444 | 1.0453 | 1.0462 | 1.0471 | 1.0480 | 1.0488 |
| Woodie | 1.0318 | 1.0346 | 1.0414 | 1.0442 | 1.0510 | 1.0538 | 1.0606 |
| Fibonacci | 1.0339 | 1.0375 | 1.0398 | 1.0435 | 1.0471 | 1.0494 | 1.0531 |
| Pivot points | S3 | S2 | S1 | PP | R1 | R2 | R3 |
|---|---|---|---|---|---|---|---|
| Standard | 0.9973 | 1.0090 | 1.0209 | 1.0326 | 1.0445 | 1.0562 | 1.0681 |
| Camarilla | 1.0263 | 1.0285 | 1.0306 | 1.0328 | 1.0350 | 1.0371 | 1.0393 |
| Woodie | 0.9974 | 1.0091 | 1.0210 | 1.0327 | 1.0446 | 1.0563 | 1.0682 |
| Fibonacci | 1.0090 | 1.0180 | 1.0236 | 1.0326 | 1.0416 | 1.0472 | 1.0562 |
| Pivot points | S3 | S2 | S1 | PP | R1 | R2 | R3 |
|---|---|---|---|---|---|---|---|
| Standard | 0.9829 | 1.0004 | 1.0184 | 1.0359 | 1.0539 | 1.0714 | 1.0894 |
| Camarilla | 1.0267 | 1.0300 | 1.0333 | 1.0365 | 1.0398 | 1.0430 | 1.0463 |
| Woodie | 0.9833 | 1.0005 | 1.0188 | 1.0360 | 1.0543 | 1.0715 | 1.0898 |
| Fibonacci | 1.0004 | 1.0139 | 1.0223 | 1.0359 | 1.0494 | 1.0578 | 1.0714 |
Numerical data
The following is the status of the technical indicators and moving averages at the time of publication of this technical analysis:
| RSI (14): | 73.69 | |
| MACD (12,26,9): | 0.0018 | |
| Directional Movement: | 21.2604 | |
| AROON (14): | 64.2857 | |
| DEMA (21): | 1.0487 | |
| Parabolic SAR (0,02-0,02-0,2): | 1.0457 | |
| Elder Ray (13): | 0.0028 | |
| Super Trend (3,10): | 1.0449 | |
| Zig ZAG (10): | 1.0509 | |
| VORTEX (21): | 1.1727 | |
| Stochastique (14,3,5): | 77.97 | |
| TEMA (21): | 1.0489 | |
| Williams %R (14): | -8.96 | |
| Chande Momentum Oscillator (20): | 0.0051 | |
| Repulse (5,40,3): | 0.3513 | |
| ROCnROLL: | 1 | |
| TRIX (15,9): | 0.0218 | |
| Courbe Coppock: | 0.46 |
| MA7: | 1.0391 | |
| MA20: | 1.0402 | |
| MA50: | 1.0398 | |
| MA100: | 1.0586 | |
| MAexp7: | 1.0482 | |
| MAexp20: | 1.0464 | |
| MAexp50: | 1.0433 | |
| MAexp100: | 1.0403 | |
| Price / MA7: | +1.14% | |
| Price / MA20: | +1.03% | |
| Price / MA50: | +1.07% | |
| Price / MA100: | -0.73% | |
| Price / MAexp7: | +0.26% | |
| Price / MAexp20: | +0.43% | |
| Price / MAexp50: | +0.73% | |
| Price / MAexp100: | +1.02% |
News
The latest news and videos published on EUR/USD at the time of the analysis were as follows:
-
 EUR/USD trading strategy: how Trump's tariffs changed everything | Trade of the Week February 2025
-
EUR/USD Analysis: Can the Euro Continue to Rise?
-
Technical Outlook on EURUSD, USDJPY, GBPUSD
-
EUR/USD Analysis: Is the Range Settled?
-
Technical Analysis on USDJPY, EURUSD, USDCAD
About author

Online


Add a comment
Comments
0 comments on the analysis EUR/USD - 1H