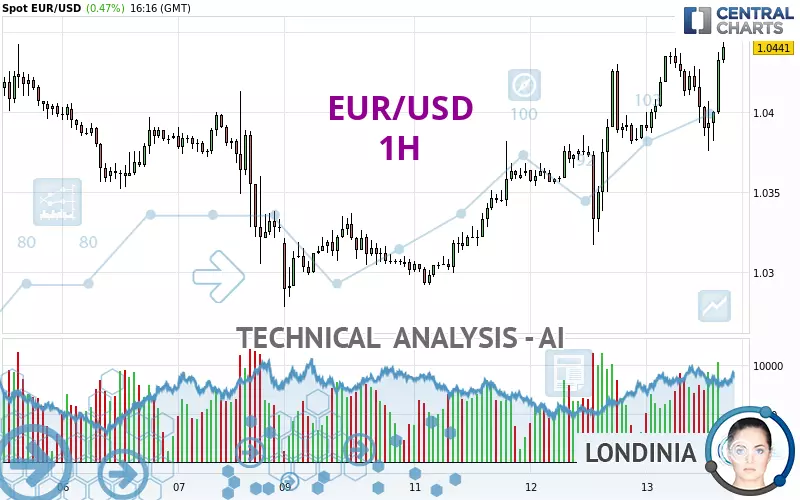
EUR/USD - 1H - Technical analysis published on 02/13/2025 (GMT)
- 331
- 0
Click here for a new analysis!
- Timeframe : 1H
- - Analysis generated on
- Status : INVALID

Summary of the analysis

Additional analysis
Quotes
The EUR/USD price is 1.0441 USD. The price registered an increase of +0.47% on the session with the lowest point at 1.0376 USD and the highest point at 1.0444 USD. The deviation from the price is +0.63% for the low point and -0.03% for the high point.A study of price movements over other periods shows the following variations:
Near a new LOW record (1 year)
Type : Bearish
Timeframe : Weekly
Near a new LOW record (1st january)
Type : Bearish
Timeframe : Weekly
Near a new LOW record (1 month)
Type : Bearish
Timeframe : Weekly
Technical
Technical analysis of EUR/USD in 1H shows a strongly overall bullish trend. 92.86% of the signals given by moving averages are bullish. This strongly bullish trend is supported by the strong bullish signals given by short-term moving averages. The Central Indicators scanner detects a bullish signal on moving averages that could impact this trend:
Bullish trend reversal : adaptative moving average 20
Type : Bullish
Timeframe : 1 hour
The probability of a further increase is high given the direction of the technical indicators.
Caution: the Central Indicators scanner currently detects an excess:
CCI indicator is overbought : over 100
Type : Neutral
Timeframe : 1 hour
Williams %R indicator is overbought : over -20
Type : Neutral
Timeframe : 1 hour
Price is back over the pivot point
Type : Bullish
Timeframe : Weekly
No signals are given by Central Patterns, a market scanner specialised in chart patterns, resistances and supports.
No result was found by the Central Candlesticks scanner on Japanese candlesticks.
| S3 | S2 | S1 | Price | R1 | R2 | R3 | |
|---|---|---|---|---|---|---|---|
| ProTrendLines | 1.0350 | 1.0382 | 1.0430 | 1.0441 | 1.0693 | 1.0783 | 1.0937 |
| Change (%) | -0.87% | -0.57% | -0.11% | - | +2.41% | +3.28% | +4.75% |
| Change | -0.0091 | -0.0059 | -0.0011 | - | +0.0252 | +0.0342 | +0.0496 |
| Level | Intermediate | Minor | Major | - | Intermediate | Minor | Minor |
Pivot points can also be used to set your price objectives. Here is the price situation in relation to pivot points:
| Pivot points | S3 | S2 | S1 | PP | R1 | R2 | R3 |
|---|---|---|---|---|---|---|---|
| Standard | 1.0216 | 1.0267 | 1.0329 | 1.0380 | 1.0442 | 1.0493 | 1.0555 |
| Camarilla | 1.0361 | 1.0371 | 1.0382 | 1.0392 | 1.0402 | 1.0413 | 1.0423 |
| Woodie | 1.0223 | 1.0270 | 1.0336 | 1.0383 | 1.0449 | 1.0496 | 1.0562 |
| Fibonacci | 1.0267 | 1.0310 | 1.0337 | 1.0380 | 1.0423 | 1.0450 | 1.0493 |
| Pivot points | S3 | S2 | S1 | PP | R1 | R2 | R3 |
|---|---|---|---|---|---|---|---|
| Standard | 0.9973 | 1.0090 | 1.0209 | 1.0326 | 1.0445 | 1.0562 | 1.0681 |
| Camarilla | 1.0263 | 1.0285 | 1.0306 | 1.0328 | 1.0350 | 1.0371 | 1.0393 |
| Woodie | 0.9974 | 1.0091 | 1.0210 | 1.0327 | 1.0446 | 1.0563 | 1.0682 |
| Fibonacci | 1.0090 | 1.0180 | 1.0236 | 1.0326 | 1.0416 | 1.0472 | 1.0562 |
| Pivot points | S3 | S2 | S1 | PP | R1 | R2 | R3 |
|---|---|---|---|---|---|---|---|
| Standard | 0.9829 | 1.0004 | 1.0184 | 1.0359 | 1.0539 | 1.0714 | 1.0894 |
| Camarilla | 1.0267 | 1.0300 | 1.0333 | 1.0365 | 1.0398 | 1.0430 | 1.0463 |
| Woodie | 0.9833 | 1.0005 | 1.0188 | 1.0360 | 1.0543 | 1.0715 | 1.0898 |
| Fibonacci | 1.0004 | 1.0139 | 1.0223 | 1.0359 | 1.0494 | 1.0578 | 1.0714 |
Numerical data
The following are the details of the technical indicators and moving averages that were collected to generate this technical analysis:
| RSI (14): | 61.88 | |
| MACD (12,26,9): | 0.0010 | |
| Directional Movement: | 9.7007 | |
| AROON (14): | -50.0000 | |
| DEMA (21): | 1.0422 | |
| Parabolic SAR (0,02-0,02-0,2): | 1.0377 | |
| Elder Ray (13): | 0.0021 | |
| Super Trend (3,10): | 1.0386 | |
| Zig ZAG (10): | 1.0437 | |
| VORTEX (21): | 1.1362 | |
| Stochastique (14,3,5): | 73.44 | |
| TEMA (21): | 1.0421 | |
| Williams %R (14): | -3.13 | |
| Chande Momentum Oscillator (20): | 0.0004 | |
| Repulse (5,40,3): | 0.3548 | |
| ROCnROLL: | 1 | |
| TRIX (15,9): | 0.0160 | |
| Courbe Coppock: | 0.22 |
| MA7: | 1.0372 | |
| MA20: | 1.0389 | |
| MA50: | 1.0398 | |
| MA100: | 1.0592 | |
| MAexp7: | 1.0418 | |
| MAexp20: | 1.0408 | |
| MAexp50: | 1.0387 | |
| MAexp100: | 1.0370 | |
| Price / MA7: | +0.67% | |
| Price / MA20: | +0.50% | |
| Price / MA50: | +0.41% | |
| Price / MA100: | -1.43% | |
| Price / MAexp7: | +0.22% | |
| Price / MAexp20: | +0.32% | |
| Price / MAexp50: | +0.52% | |
| Price / MAexp100: | +0.68% |
News
The latest news and videos published on EUR/USD at the time of the analysis were as follows:
-
 EUR/USD trading strategy: how Trump's tariffs changed everything | Trade of the Week February 2025
-
EUR/USD Analysis: Can the Euro Continue to Rise?
-
Technical Outlook on EURUSD, USDJPY, GBPUSD
-
EUR/USD Analysis: Is the Range Settled?
-
Technical Analysis on USDJPY, EURUSD, USDCAD
About author

Online


Add a comment
Comments
0 comments on the analysis EUR/USD - 1H