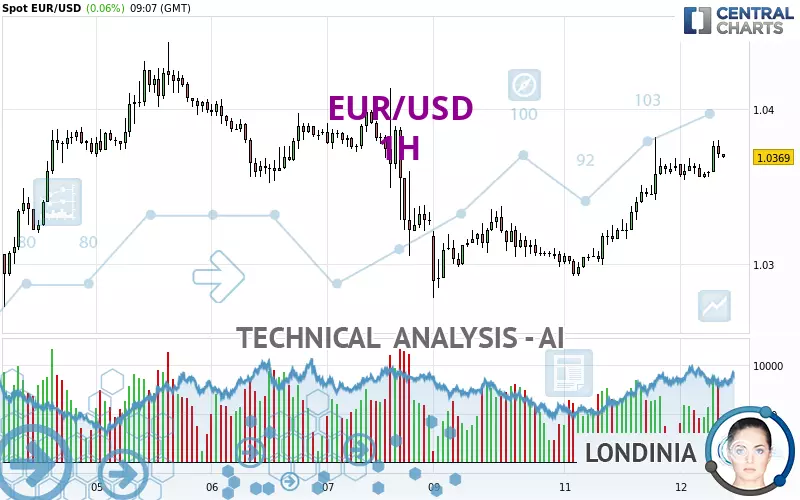
EUR/USD - 1H - Technical analysis published on 02/12/2025 (GMT)
- 175
- 0
Click here for a new analysis!
- Timeframe : 1H
- - Analysis generated on
- Status : INVALID

Summary of the analysis

Additional analysis
Quotes
The EUR/USD price is 1.0369 USD. The price has increased by +0.06% since the last closing with the lowest point at 1.0354 USD and the highest point at 1.0380 USD. The deviation from the price is +0.14% for the low point and -0.11% for the high point.The Central Gaps scanner detects a bullish opening. A small advantage for buyers in the very short term.
Bullish opening
Type : Bullish
Timeframe : Openning
So that you have an overall view of the price change, here is a table showing the variations over several periods:
Near a new LOW record (1 year)
Type : Bearish
Timeframe : Weekly
Near a new HIGH record (1st january)
Type : Bullish
Timeframe : Weekly
Near a new HIGH record (1 month)
Type : Bullish
Timeframe : Weekly
Technical
A technical analysis in 1H of this EUR/USD chart shows a bullish trend. The signals returned by the moving averages are 75.00% bullish. This bullish trend is reinforced by the strong signals currently being given by short-term moving averages. The Central Indicators market scanner currently does not detect any result that concerns moving averages.
The probability of a further increase is high given the direction of the technical indicators.
Caution: the Central Indicators scanner currently detects an excess:
RSI indicator is overbought : over 70
Type : Neutral
Timeframe : 1 hour
CCI indicator is overbought : over 100
Type : Neutral
Timeframe : 1 hour
Williams %R indicator is overbought : over -20
Type : Neutral
Timeframe : 1 hour
Price is back over the pivot point
Type : Bullish
Timeframe : Weekly
An analysis of the price chart with the Central Patterns scanner (detector of chart patterns and resistances and supports) shows several results that can have an impact on the price change:
Near resistance of channel
Type : Bearish
Timeframe : 1 hour
Near resistance of triangle
Type : Bearish
Timeframe : 1 hour
The Central Candlesticks scanner, specialised in Japanese candlesticks, did not identify any signals.
| S3 | S2 | S1 | Price | R1 | R2 | R3 | |
|---|---|---|---|---|---|---|---|
| ProTrendLines | 1.0245 | 1.0292 | 1.0350 | 1.0369 | 1.0373 | 1.0430 | 1.0693 |
| Change (%) | -1.20% | -0.74% | -0.18% | - | +0.04% | +0.59% | +3.12% |
| Change | -0.0124 | -0.0077 | -0.0019 | - | +0.0004 | +0.0061 | +0.0324 |
| Level | Major | Intermediate | Intermediate | - | Minor | Major | Intermediate |
Pivot points can also be used to set your price objectives. Here is the price situation in relation to pivot points:
| Pivot points | S3 | S2 | S1 | PP | R1 | R2 | R3 |
|---|---|---|---|---|---|---|---|
| Standard | 1.0219 | 1.0256 | 1.0309 | 1.0346 | 1.0399 | 1.0436 | 1.0489 |
| Camarilla | 1.0338 | 1.0347 | 1.0355 | 1.0363 | 1.0371 | 1.0380 | 1.0388 |
| Woodie | 1.0228 | 1.0260 | 1.0318 | 1.0350 | 1.0408 | 1.0440 | 1.0498 |
| Fibonacci | 1.0256 | 1.0290 | 1.0311 | 1.0346 | 1.0380 | 1.0401 | 1.0436 |
| Pivot points | S3 | S2 | S1 | PP | R1 | R2 | R3 |
|---|---|---|---|---|---|---|---|
| Standard | 0.9973 | 1.0090 | 1.0209 | 1.0326 | 1.0445 | 1.0562 | 1.0681 |
| Camarilla | 1.0263 | 1.0285 | 1.0306 | 1.0328 | 1.0350 | 1.0371 | 1.0393 |
| Woodie | 0.9974 | 1.0091 | 1.0210 | 1.0327 | 1.0446 | 1.0563 | 1.0682 |
| Fibonacci | 1.0090 | 1.0180 | 1.0236 | 1.0326 | 1.0416 | 1.0472 | 1.0562 |
| Pivot points | S3 | S2 | S1 | PP | R1 | R2 | R3 |
|---|---|---|---|---|---|---|---|
| Standard | 0.9829 | 1.0004 | 1.0184 | 1.0359 | 1.0539 | 1.0714 | 1.0894 |
| Camarilla | 1.0267 | 1.0300 | 1.0333 | 1.0365 | 1.0398 | 1.0430 | 1.0463 |
| Woodie | 0.9833 | 1.0005 | 1.0188 | 1.0360 | 1.0543 | 1.0715 | 1.0898 |
| Fibonacci | 1.0004 | 1.0139 | 1.0223 | 1.0359 | 1.0494 | 1.0578 | 1.0714 |
Numerical data
The following are the details of the technical indicators and moving averages that were collected to generate this technical analysis:
| RSI (14): | 74.31 | |
| MACD (12,26,9): | 0.0012 | |
| Directional Movement: | 26.7730 | |
| AROON (14): | 0 | |
| DEMA (21): | 1.0369 | |
| Parabolic SAR (0,02-0,02-0,2): | 1.0354 | |
| Elder Ray (13): | 0.0015 | |
| Super Trend (3,10): | 1.0345 | |
| Zig ZAG (10): | 1.0376 | |
| VORTEX (21): | 1.2400 | |
| Stochastique (14,3,5): | 71.54 | |
| TEMA (21): | 1.0376 | |
| Williams %R (14): | -14.63 | |
| Chande Momentum Oscillator (20): | 0.0013 | |
| Repulse (5,40,3): | 0.1408 | |
| ROCnROLL: | 1 | |
| TRIX (15,9): | 0.0169 | |
| Courbe Coppock: | 0.41 |
| MA7: | 1.0360 | |
| MA20: | 1.0381 | |
| MA50: | 1.0399 | |
| MA100: | 1.0599 | |
| MAexp7: | 1.0366 | |
| MAexp20: | 1.0354 | |
| MAexp50: | 1.0342 | |
| MAexp100: | 1.0344 | |
| Price / MA7: | +0.09% | |
| Price / MA20: | -0.12% | |
| Price / MA50: | -0.29% | |
| Price / MA100: | -2.17% | |
| Price / MAexp7: | +0.03% | |
| Price / MAexp20: | +0.14% | |
| Price / MAexp50: | +0.26% | |
| Price / MAexp100: | +0.24% |
News
Don't forget to follow the news on EUR/USD. At the time of publication of this analysis, the latest news was as follows:
-
 EUR/USD trading strategy: how Trump's tariffs changed everything | Trade of the Week February 2025
-
EUR/USD Analysis: Can the Euro Continue to Rise?
-
Technical Outlook on EURUSD, USDJPY, GBPUSD
-
EUR/USD Analysis: Is the Range Settled?
-
Technical Analysis on USDJPY, EURUSD, USDCAD
About author

Online


Add a comment
Comments
0 comments on the analysis EUR/USD - 1H