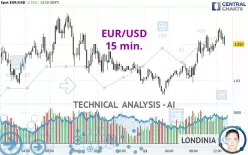
EUR/USD - 15 min. - Technical analysis published on 02/11/2025 (GMT)
- 270
- 0
- Who voted?
Click here for a new analysis!
- Timeframe : 15 min.
- - Analysis generated on
- Status : TARGET REACHED

Summary of the analysis

Additional analysis
Quotes
The EUR/USD rating is 1.0321 USD. The price registered an increase of +0.19% on the session with the lowest point at 1.0292 USD and the highest point at 1.0329 USD. The deviation from the price is +0.28% for the low point and -0.08% for the high point.So that you have an overall view of the price change, here is a table showing the variations over several periods:
Near a new LOW record (1 year)
Type : Bearish
Timeframe : Weekly
Near a new HIGH record (1st january)
Type : Bullish
Timeframe : Weekly
Near a new HIGH record (1 month)
Type : Bullish
Timeframe : Weekly
Technical
Technical analysis of EUR/USD in 15 min. shows an overall bullish trend. The signals returned by the moving averages are 75.00% bullish. This bullish trend is reinforced by the strong signals currently being given by short-term moving averages. An assessment of moving averages reveals a bullish signal that could impact this trend:
Bullish trend reversal : Moving Average 100
Type : Bullish
Timeframe : 15 minutes
In fact, according to the parameters integrated into the Central Analyzer system, 12 technical indicators out of 18 analysed are currently bullish. Caution: the Central Indicators scanner currently detects an excess:
CCI indicator is overbought : over 100
Type : Neutral
Timeframe : 15 minutes
RSI indicator: bearish divergence
Type : Bearish
Timeframe : 15 minutes
Williams %R indicator is overbought : over -20
Type : Neutral
Timeframe : 15 minutes
Central Patterns, the market scanner focusing on chart patterns, resistances and supports found these results:
Near resistance of channel
Type : Bearish
Timeframe : 15 minutes
Near resistance of triangle
Type : Bearish
Timeframe : 15 minutes
Central Candlesticks, the scanner specialised in Japanese candlesticks, detects this inversion signal that could impact the current short-term trend:
Doji
Type : Neutral
Timeframe : 15 minutes
| S3 | S2 | S1 | Price | R1 | R2 | R3 | |
|---|---|---|---|---|---|---|---|
| ProTrendLines | 1.0245 | 1.0278 | 1.0304 | 1.0321 | 1.0351 | 1.0430 | 1.0468 |
| Change (%) | -0.74% | -0.42% | -0.16% | - | +0.29% | +1.06% | +1.42% |
| Change | -0.0076 | -0.0043 | -0.0017 | - | +0.0030 | +0.0109 | +0.0147 |
| Level | Major | Major | Minor | - | Intermediate | Major | Minor |
Pivot points can also be used to set your price objectives. Here is the price situation in relation to pivot points:
| Pivot points | S3 | S2 | S1 | PP | R1 | R2 | R3 |
|---|---|---|---|---|---|---|---|
| Standard | 1.0215 | 1.0246 | 1.0274 | 1.0305 | 1.0333 | 1.0364 | 1.0392 |
| Camarilla | 1.0285 | 1.0290 | 1.0296 | 1.0301 | 1.0306 | 1.0312 | 1.0317 |
| Woodie | 1.0213 | 1.0245 | 1.0272 | 1.0304 | 1.0331 | 1.0363 | 1.0390 |
| Fibonacci | 1.0246 | 1.0269 | 1.0283 | 1.0305 | 1.0328 | 1.0342 | 1.0364 |
| Pivot points | S3 | S2 | S1 | PP | R1 | R2 | R3 |
|---|---|---|---|---|---|---|---|
| Standard | 0.9973 | 1.0090 | 1.0209 | 1.0326 | 1.0445 | 1.0562 | 1.0681 |
| Camarilla | 1.0263 | 1.0285 | 1.0306 | 1.0328 | 1.0350 | 1.0371 | 1.0393 |
| Woodie | 0.9974 | 1.0091 | 1.0210 | 1.0327 | 1.0446 | 1.0563 | 1.0682 |
| Fibonacci | 1.0090 | 1.0180 | 1.0236 | 1.0326 | 1.0416 | 1.0472 | 1.0562 |
| Pivot points | S3 | S2 | S1 | PP | R1 | R2 | R3 |
|---|---|---|---|---|---|---|---|
| Standard | 0.9829 | 1.0004 | 1.0184 | 1.0359 | 1.0539 | 1.0714 | 1.0894 |
| Camarilla | 1.0267 | 1.0300 | 1.0333 | 1.0365 | 1.0398 | 1.0430 | 1.0463 |
| Woodie | 0.9833 | 1.0005 | 1.0188 | 1.0360 | 1.0543 | 1.0715 | 1.0898 |
| Fibonacci | 1.0004 | 1.0139 | 1.0223 | 1.0359 | 1.0494 | 1.0578 | 1.0714 |
Numerical data
The following is the status of the technical indicators and moving averages at the time of publication of this technical analysis:
| RSI (14): | 65.52 | |
| MACD (12,26,9): | 0.0005 | |
| Directional Movement: | 16.6762 | |
| AROON (14): | 85.7142 | |
| DEMA (21): | 1.0324 | |
| Parabolic SAR (0,02-0,02-0,2): | 1.0318 | |
| Elder Ray (13): | 0.0007 | |
| Super Trend (3,10): | 1.0312 | |
| Zig ZAG (10): | 1.0326 | |
| VORTEX (21): | 1.1901 | |
| Stochastique (14,3,5): | 89.59 | |
| TEMA (21): | 1.0326 | |
| Williams %R (14): | -11.76 | |
| Chande Momentum Oscillator (20): | 0.0009 | |
| Repulse (5,40,3): | 0.0323 | |
| ROCnROLL: | 1 | |
| TRIX (15,9): | 0.0062 | |
| Courbe Coppock: | 0.19 |
| MA7: | 1.0348 | |
| MA20: | 1.0375 | |
| MA50: | 1.0401 | |
| MA100: | 1.0606 | |
| MAexp7: | 1.0324 | |
| MAexp20: | 1.0318 | |
| MAexp50: | 1.0312 | |
| MAexp100: | 1.0313 | |
| Price / MA7: | -0.26% | |
| Price / MA20: | -0.52% | |
| Price / MA50: | -0.77% | |
| Price / MA100: | -2.69% | |
| Price / MAexp7: | -0.03% | |
| Price / MAexp20: | +0.03% | |
| Price / MAexp50: | +0.09% | |
| Price / MAexp100: | +0.08% |
News
The latest news and videos published on EUR/USD at the time of the analysis were as follows:
-
 EUR/USD trading strategy: how Trump's tariffs changed everything | Trade of the Week February 2025
-
EUR/USD Analysis: Can the Euro Continue to Rise?
-
Technical Outlook on EURUSD, USDJPY, GBPUSD
-
EUR/USD Analysis: Is the Range Settled?
-
Technical Analysis on USDJPY, EURUSD, USDCAD
About author

Online


Add a comment
Comments
0 comments on the analysis EUR/USD - 15 min.