| Open: | 1.0853 |
| Change: | -0.0042 |
| Volume: | 121,982 |
| Low: | 1.0797 |
| High: | 1.0861 |
| High / Low range: | 0.0064 |
| Type: | Forex |
| Ticker: | EURUSD |
| ISIN: |
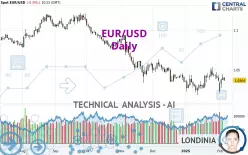
EUR/USD - Daily - Technical analysis published on 02/06/2025 (GMT)
- 185
- 0
- 02/06/2025 - 10:23
Click here for a new analysis!
- Timeframe : Daily
- - Analysis generated on 02/06/2025 - 10:23
- Status : INVALID

Summary of the analysis

Additional analysis
Quotes
EUR/USD rating 1.0364 USD. The price is lower by -0.34% since the last closing and was between 1.0356 USD and 1.0406 USD. This implies that the price is at +0.08% from its lowest and at -0.40% from its highest.So that you have an overall view of the price change, here is a table showing the variations over several periods:
Near a new LOW record (1 year)
Type : Bearish
Timeframe : Weekly
Near a new LOW record (1st january)
Type : Bearish
Timeframe : Weekly
Near a new LOW record (1 month)
Type : Bearish
Timeframe : Weekly
Technical
Technical analysis of EUR/USD in Daily shows a overall strongly bearish trend. The signals given by moving averages are 89.29% bearish. This strongly bearish trend seems to be slowing down given the slightly bearish signals being given by short-term moving averages. The Central Indicators scanner detects a bearish signal on moving averages that could impact this trend:
Bearish price crossover with Moving Average 20
Type : Bearish
Timeframe : Daily
In fact, Central Analyzer took into account 18 technical indicators and the result was as follows: 4 are bullish, 8 are neutral and 6 are bearish. Central Indicators, the detector scanner for these technical indicators has recently detected several signals:
Pivot points : price is under support 1
Type : Neutral
Timeframe : Daily
RSI indicator is back under 50
Type : Bearish
Timeframe : Daily
Williams %R indicator is back under -50
Type : Bearish
Timeframe : Daily
The analysis of the price chart with Central Patterns scanners does not return any result.
No result was found by the Central Candlesticks scanner on Japanese candlesticks.
| S3 | S2 | S1 | Price | R1 | R2 | R3 | |
|---|---|---|---|---|---|---|---|
| ProTrendLines | 0.9596 | 1.0245 | 1.0350 | 1.0364 | 1.0430 | 1.0693 | 1.0783 |
| Change (%) | -7.41% | -1.15% | -0.14% | - | +0.64% | +3.17% | +4.04% |
| Change | -0.0768 | -0.0119 | -0.0014 | - | +0.0066 | +0.0329 | +0.0419 |
| Level | Major | Intermediate | Intermediate | - | Major | Intermediate | Minor |
To determine price objectives, it is also possible to use the pivot points. Here is the price position in relation to pivot points:
| Pivot points | S3 | S2 | S1 | PP | R1 | R2 | R3 |
|---|---|---|---|---|---|---|---|
| Standard | 1.0290 | 1.0330 | 1.0364 | 1.0404 | 1.0438 | 1.0478 | 1.0512 |
| Camarilla | 1.0379 | 1.0385 | 1.0392 | 1.0399 | 1.0406 | 1.0413 | 1.0419 |
| Woodie | 1.0288 | 1.0329 | 1.0362 | 1.0403 | 1.0436 | 1.0477 | 1.0510 |
| Fibonacci | 1.0330 | 1.0358 | 1.0375 | 1.0404 | 1.0432 | 1.0449 | 1.0478 |
| Pivot points | S3 | S2 | S1 | PP | R1 | R2 | R3 |
|---|---|---|---|---|---|---|---|
| Standard | 1.0116 | 1.0233 | 1.0299 | 1.0416 | 1.0482 | 1.0599 | 1.0665 |
| Camarilla | 1.0315 | 1.0332 | 1.0348 | 1.0365 | 1.0382 | 1.0399 | 1.0415 |
| Woodie | 1.0091 | 1.0220 | 1.0274 | 1.0403 | 1.0457 | 1.0586 | 1.0640 |
| Fibonacci | 1.0233 | 1.0303 | 1.0346 | 1.0416 | 1.0486 | 1.0529 | 1.0599 |
| Pivot points | S3 | S2 | S1 | PP | R1 | R2 | R3 |
|---|---|---|---|---|---|---|---|
| Standard | 0.9829 | 1.0004 | 1.0184 | 1.0359 | 1.0539 | 1.0714 | 1.0894 |
| Camarilla | 1.0267 | 1.0300 | 1.0333 | 1.0365 | 1.0398 | 1.0430 | 1.0463 |
| Woodie | 0.9833 | 1.0005 | 1.0188 | 1.0360 | 1.0543 | 1.0715 | 1.0898 |
| Fibonacci | 1.0004 | 1.0139 | 1.0223 | 1.0359 | 1.0494 | 1.0578 | 1.0714 |
Numerical data
The following is the status of the technical indicators and moving averages at the time of publication of this technical analysis:
| RSI (14): | 46.74 | |
| MACD (12,26,9): | -0.0007 | |
| Directional Movement: | -2.2012 | |
| AROON (14): | -35.7143 | |
| DEMA (21): | 1.0369 | |
| Parabolic SAR (0,02-0,02-0,2): | 1.0492 | |
| Elder Ray (13): | 0 | |
| Super Trend (3,10): | 1.0216 | |
| Zig ZAG (10): | 1.0361 | |
| VORTEX (21): | 1.0385 | |
| Stochastique (14,3,5): | 52.35 | |
| TEMA (21): | 1.0396 | |
| Williams %R (14): | -52.76 | |
| Chande Momentum Oscillator (20): | -0.0045 | |
| Repulse (5,40,3): | 0.1228 | |
| ROCnROLL: | 2 | |
| TRIX (15,9): | -0.0090 | |
| Courbe Coppock: | 1.23 |
| MA7: | 1.0378 | |
| MA20: | 1.0367 | |
| MA50: | 1.0415 | |
| MA100: | 1.0631 | |
| MAexp7: | 1.0379 | |
| MAexp20: | 1.0382 | |
| MAexp50: | 1.0442 | |
| MAexp100: | 1.0563 | |
| Price / MA7: | -0.13% | |
| Price / MA20: | -0.03% | |
| Price / MA50: | -0.49% | |
| Price / MA100: | -2.51% | |
| Price / MAexp7: | -0.14% | |
| Price / MAexp20: | -0.17% | |
| Price / MAexp50: | -0.75% | |
| Price / MAexp100: | -1.88% |
News
The latest news and videos published on EUR/USD at the time of the analysis were as follows:
-
02/04/2025 - 16:09
 EUR/USD Analysis: Can the Euro Continue to Rise?
-
02/03/2025 - 14:26
Technical Outlook on EURUSD, USDJPY, GBPUSD
-
01/30/2025 - 17:34
EUR/USD Analysis: Is the Range Settled?
-
01/27/2025 - 11:59
Technical Analysis on USDJPY, EURUSD, USDCAD
-
01/24/2025 - 17:04
EUR/USD Price Forecast - Can the Euro Breakout?
About author

Online


Add a comment
Comments
0 comments on the analysis EUR/USD - Daily