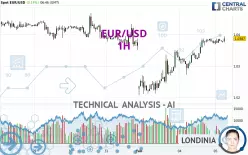
EUR/USD - 1H - Technical analysis published on 02/05/2025 (GMT)
- 139
- 0
Click here for a new analysis!
- Timeframe : 1H
- - Analysis generated on
- Status : TARGET REACHED
Summary of the analysis

Additional analysis
Quotes
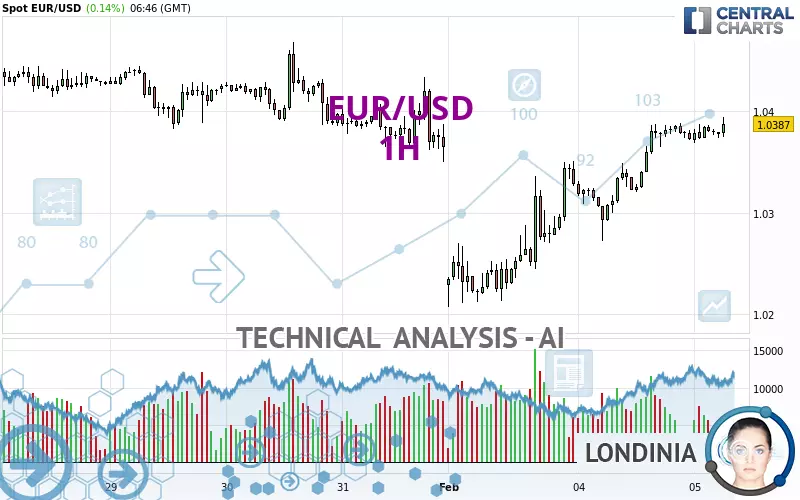
The EUR/USD rating is 1.0387 USD. The price has increased by +0.15% since the last closing and was between 1.0369 USD and 1.0394 USD. This implies that the price is at +0.17% from its lowest and at -0.07% from its highest.The Central Gaps scanner detects a bearish opening marking the presence of sellers ahead of buyers at the opening but not sufficiently marked to allow the price to register a quotation gap.
Bearish opening
Type : Bearish
Timeframe : Openning
A study of price movements over other periods shows the following variations:
Near a new LOW record (1 year)
Type : Bearish
Timeframe : Weekly
Near a new LOW record (1st january)
Type : Bearish
Timeframe : Weekly
Near a new LOW record (1 month)
Type : Bearish
Timeframe : Weekly
Technical
Technical analysis of EUR/USD in 1H shows an overall bullish trend. 75.00% of the signals given by moving averages are bullish. This bullish trend is supported by the strong bullish signals given by short-term moving averages. The Central Indicators scanner detects a bullish signal on moving averages that could impact this trend:
Moving Average bullish crossovers : AMA50 & AMA100
Type : Bullish
Timeframe : 1 hour
In fact, only 7 technical indicators out of 18 studied are currently positioned bullish. Central Indicators, the scanner specialised in technical indicators, has identified this signal:
Parabolic SAR indicator bullish reversal
Type : Bullish
Timeframe : 1 hour
An analysis of the price chart with the Central Patterns scanner (detector of chart patterns and resistances and supports) shows several results that can have an impact on the price change:
Near resistance of channel
Type : Bearish
Timeframe : 1 hour
Near resistance of triangle
Type : Bearish
Timeframe : 1 hour
Central Candlesticks, the scanner specialised in Japanese candlesticks, detects this inversion signal that could impact the current short-term trend:
Doji
Type : Neutral
Timeframe : 1 hour
| S3 | S2 | S1 | Price | R1 | R2 | R3 | |
|---|---|---|---|---|---|---|---|
| ProTrendLines | 1.0320 | 1.0350 | 1.0382 | 1.0387 | 1.0430 | 1.0468 | 1.0533 |
| Change (%) | -0.65% | -0.36% | -0.05% | - | +0.41% | +0.78% | +1.41% |
| Change | -0.0067 | -0.0037 | -0.0005 | - | +0.0043 | +0.0081 | +0.0146 |
| Level | Minor | Intermediate | Minor | - | Major | Minor | Minor |
Pivot points can also be used to set your price objectives. Here is the price situation in relation to pivot points:
| Pivot points | S3 | S2 | S1 | PP | R1 | R2 | R3 |
|---|---|---|---|---|---|---|---|
| Standard | 1.0184 | 1.0228 | 1.0300 | 1.0344 | 1.0416 | 1.0460 | 1.0532 |
| Camarilla | 1.0340 | 1.0351 | 1.0361 | 1.0372 | 1.0383 | 1.0393 | 1.0404 |
| Woodie | 1.0198 | 1.0235 | 1.0314 | 1.0351 | 1.0430 | 1.0467 | 1.0546 |
| Fibonacci | 1.0228 | 1.0272 | 1.0300 | 1.0344 | 1.0388 | 1.0416 | 1.0460 |
| Pivot points | S3 | S2 | S1 | PP | R1 | R2 | R3 |
|---|---|---|---|---|---|---|---|
| Standard | 1.0116 | 1.0233 | 1.0299 | 1.0416 | 1.0482 | 1.0599 | 1.0665 |
| Camarilla | 1.0315 | 1.0332 | 1.0348 | 1.0365 | 1.0382 | 1.0399 | 1.0415 |
| Woodie | 1.0091 | 1.0220 | 1.0274 | 1.0403 | 1.0457 | 1.0586 | 1.0640 |
| Fibonacci | 1.0233 | 1.0303 | 1.0346 | 1.0416 | 1.0486 | 1.0529 | 1.0599 |
| Pivot points | S3 | S2 | S1 | PP | R1 | R2 | R3 |
|---|---|---|---|---|---|---|---|
| Standard | 0.9829 | 1.0004 | 1.0184 | 1.0359 | 1.0539 | 1.0714 | 1.0894 |
| Camarilla | 1.0267 | 1.0300 | 1.0333 | 1.0365 | 1.0398 | 1.0430 | 1.0463 |
| Woodie | 0.9833 | 1.0005 | 1.0188 | 1.0360 | 1.0543 | 1.0715 | 1.0898 |
| Fibonacci | 1.0004 | 1.0139 | 1.0223 | 1.0359 | 1.0494 | 1.0578 | 1.0714 |
Numerical data
The following is the status of technical indicators and moving averages registered at the time this technical analysis was created:
| RSI (14): | 63.79 | |
| MACD (12,26,9): | 0.0015 | |
| Directional Movement: | 16.3253 | |
| AROON (14): | 92.8571 | |
| DEMA (21): | 1.0389 | |
| Parabolic SAR (0,02-0,02-0,2): | 1.0373 | |
| Elder Ray (13): | 0.0009 | |
| Super Trend (3,10): | 1.0345 | |
| Zig ZAG (10): | 1.0388 | |
| VORTEX (21): | 1.1544 | |
| Stochastique (14,3,5): | 66.01 | |
| TEMA (21): | 1.0392 | |
| Williams %R (14): | -24.14 | |
| Chande Momentum Oscillator (20): | 0.0006 | |
| Repulse (5,40,3): | 0.0888 | |
| ROCnROLL: | 1 | |
| TRIX (15,9): | 0.0256 | |
| Courbe Coppock: | 0.37 |
| MA7: | 1.0386 | |
| MA20: | 1.0363 | |
| MA50: | 1.0418 | |
| MA100: | 1.0638 | |
| MAexp7: | 1.0380 | |
| MAexp20: | 1.0368 | |
| MAexp50: | 1.0348 | |
| MAexp100: | 1.0354 | |
| Price / MA7: | +0.01% | |
| Price / MA20: | +0.23% | |
| Price / MA50: | -0.30% | |
| Price / MA100: | -2.36% | |
| Price / MAexp7: | +0.07% | |
| Price / MAexp20: | +0.18% | |
| Price / MAexp50: | +0.38% | |
| Price / MAexp100: | +0.32% |
News
The latest news and videos published on EUR/USD at the time of the analysis were as follows:
-
 EUR/USD Analysis: Can the Euro Continue to Rise?
-
Technical Outlook on EURUSD, USDJPY, GBPUSD
-
EUR/USD Analysis: Is the Range Settled?
-
Technical Analysis on USDJPY, EURUSD, USDCAD
-
EUR/USD Price Forecast - Can the Euro Breakout?
About author

Online


Add a comment
Comments
0 comments on the analysis EUR/USD - 1H