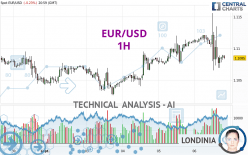
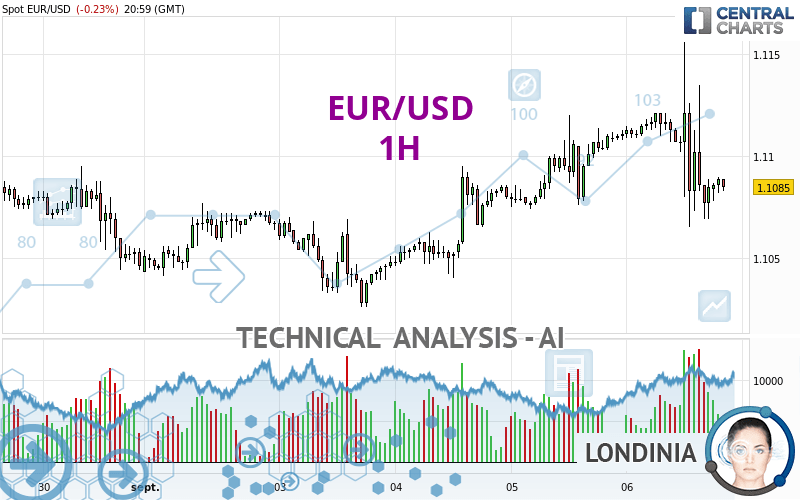
EUR/USD - 1H - Technical analysis published on 09/07/2024 (GMT)
- 116
- 0
I am delighted to see that my first price objective has been achieved. I hope you've taken advantage of it.
Click here for a new analysis!
Click here for a new analysis!
- Timeframe : 1H
- - Analysis generated on
- Status : TARGET REACHED
Summary of the analysis
Trends
Short term:
Strongly bearish
Underlying:
Neutral
Technical indicators
17%
50%
33%
My opinion
Bearish under 1.1108 USD
My targets
1.1073 USD (-0.0012)
1.1055 USD (-0.0030)
My analysis
The current short-term bearish trend is expected to quickly fix the basic bearish trend. To avoid contradicting the short term, it would be possible to favour short positions (for sale) for EUR/USD as long as the price remains well below 1.1108 USD. The sellers' bearish objective is set at 1.1073 USD. A bearish break of this support would revive the bearish momentum. The sellers could then target the support located at 1.1055 USD. If there is any crossing, the next objective would be the support located at 1.1041 USD.
Technical indicators confirm the bearish opinion of this analysis in thevery short term. However, be careful of excessive bearish movements. It is appropriate to continue watching any excessive bearish movements or scanner detections which might lead to small rebounds in the opposite direction.
Force
0
10
2.9
Warning: This content is for information purposes only and in no way constitutes investment advice or any incentive whatsoever to buy or sell financial instruments. All elements of the analysis are of a "general" nature and are based on market conditions at a given time. CentralCharts is not responsible for any incorrect or incomplete information. Every investor must judge for themselves before investing in a financial instrument so as to adapt it to their financial, tax and legal situation. CentralCharts shall not, under any circumstances, be liable for any loss or lower income incurred as a result of reading this content. Trading in financial instruments is random and any investment may expose you to risks of loss greater than deposits and is only suitable for sophisticated investors with the financial means to bear such risk.

This analysis was given by SnInvest. Take part yourself by sharing additional analysis on another time unit:
Additional analysis
Quotes
EUR/USD rating 1.1085 USD. The price is lower by -0.23% since the last closing and was traded between 1.1065 USD and 1.1156 USD over the period. The price is currently at +0.18% from its lowest and -0.64% from its highest.1.1065
1.1156
1.1085
Here is a more detailed summary of the historical variations registered by EUR/USD:
Near a new HIGH record (1 year)
Type : Bullish
Timeframe : Weekly
Near a new LOW record (1st january)
Type : Bearish
Timeframe : Weekly
Near a new LOW record (1 month)
Type : Bearish
Timeframe : Weekly
Technical
Technical analysis of this 1H chart of EUR/USD indicates that the overall trend is not clearly defined. This indecision could turn into a bearish trend due to the strong bearish signals currently being given by short-term moving averages. The Central Indicators market scanner currently does not detect any result that concerns moving averages.
In fact, only 9 technical indicators out of 18 studied are currently positioned bearish. The Central Indicators scanner specialised in technical indicators, has not detected anything further.
An analysis of the price chart with the Central Patterns scanner (detector of chart patterns and resistances and supports) shows several results that can have an impact on the price change:
Near horizontal support
Type : Bullish
Timeframe : 1 hour
Support of channel is broken
Type : Bearish
Timeframe : 1 hour
No result was found by the Central Candlesticks scanner on Japanese candlesticks.
ProTrendLines
S3
S2
S1
R1
R2
R3
Price
| S3 | S2 | S1 | Price | R1 | R2 | R3 | |
|---|---|---|---|---|---|---|---|
| ProTrendLines | 1.1041 | 1.1055 | 1.1073 | 1.1085 | 1.1108 | 1.1140 | 1.1156 |
| Change (%) | -0.40% | -0.27% | -0.11% | - | +0.21% | +0.50% | +0.64% |
| Change | -0.0044 | -0.0030 | -0.0012 | - | +0.0023 | +0.0055 | +0.0071 |
| Level | Intermediate | Minor | Intermediate | - | Intermediate | Minor | Intermediate |
To determine price objectives, it is also possible to use the pivot points. Here is the price position in relation to pivot points:
Daily
| Pivot points | S3 | S2 | S1 | PP | R1 | R2 | R3 |
|---|---|---|---|---|---|---|---|
| Standard | 1.0957 | 1.1011 | 1.1048 | 1.1102 | 1.1139 | 1.1193 | 1.1230 |
| Camarilla | 1.1060 | 1.1068 | 1.1077 | 1.1085 | 1.1093 | 1.1102 | 1.1110 |
| Woodie | 1.0949 | 1.1007 | 1.1040 | 1.1098 | 1.1131 | 1.1189 | 1.1222 |
| Fibonacci | 1.1011 | 1.1046 | 1.1067 | 1.1102 | 1.1137 | 1.1158 | 1.1193 |
Weekly
| Pivot points | S3 | S2 | S1 | PP | R1 | R2 | R3 |
|---|---|---|---|---|---|---|---|
| Standard | 1.0892 | 1.0959 | 1.1022 | 1.1089 | 1.1152 | 1.1219 | 1.1282 |
| Camarilla | 1.1049 | 1.1061 | 1.1073 | 1.1085 | 1.1097 | 1.1109 | 1.1121 |
| Woodie | 1.0890 | 1.0958 | 1.1020 | 1.1088 | 1.1150 | 1.1218 | 1.1280 |
| Fibonacci | 1.0959 | 1.1009 | 1.1039 | 1.1089 | 1.1139 | 1.1169 | 1.1219 |
Monthly
| Pivot points | S3 | S2 | S1 | PP | R1 | R2 | R3 |
|---|---|---|---|---|---|---|---|
| Standard | 1.0390 | 1.0583 | 1.0815 | 1.1008 | 1.1240 | 1.1433 | 1.1665 |
| Camarilla | 1.0929 | 1.0968 | 1.1007 | 1.1046 | 1.1085 | 1.1124 | 1.1163 |
| Woodie | 1.0409 | 1.0593 | 1.0834 | 1.1018 | 1.1259 | 1.1443 | 1.1684 |
| Fibonacci | 1.0583 | 1.0746 | 1.0846 | 1.1008 | 1.1171 | 1.1271 | 1.1433 |
Numerical data
The following are the details of the technical indicators and moving averages that were collected to generate this technical analysis:
Technical indicators
Moving averages
| RSI (14): | 43.34 | |
| MACD (12,26,9): | -0.0004 | |
| Directional Movement: | 11.2576 | |
| AROON (14): | -7.1429 | |
| DEMA (21): | 1.1094 | |
| Parabolic SAR (0,02-0,02-0,2): | 1.1146 | |
| Elder Ray (13): | -0.0008 | |
| Super Trend (3,10): | 1.1144 | |
| Zig ZAG (10): | 1.1085 | |
| VORTEX (21): | 0.9330 | |
| Stochastique (14,3,5): | 23.81 | |
| TEMA (21): | 1.1085 | |
| Williams %R (14): | -78.02 | |
| Chande Momentum Oscillator (20): | -0.0032 | |
| Repulse (5,40,3): | -0.0003 | |
| ROCnROLL: | 2 | |
| TRIX (15,9): | -0.0006 | |
| Courbe Coppock: | 0.50 |
| MA7: | 1.1074 | |
| MA20: | 1.1080 | |
| MA50: | 1.0948 | |
| MA100: | 1.0862 | |
| MAexp7: | 1.1089 | |
| MAexp20: | 1.1097 | |
| MAexp50: | 1.1094 | |
| MAexp100: | 1.1088 | |
| Price / MA7: | +0.10% | |
| Price / MA20: | +0.05% | |
| Price / MA50: | +1.25% | |
| Price / MA100: | +2.05% | |
| Price / MAexp7: | -0.04% | |
| Price / MAexp20: | -0.11% | |
| Price / MAexp50: | -0.08% | |
| Price / MAexp100: | -0.03% |
Quotes :
-
Real time data
-
Forex
News
The latest news and videos published on EUR/USD at the time of the analysis were as follows:
-
 EUR/USD Forecast September 4, 2024
-
Euro Keeps Twisting and Turning: EUR/USD Forecast & Technical Analysis by Chris Lewis (September 02)
-
Technical Outlook on US dollar index, EURUSD, USDJPY
-
EUR/USD Forecast August 26, 2024
-
EUR/USD Pulls Back Slightly: Forecast & Technical Analysis by Chris Lewis (August 21)
This member declared not having a position on this financial instrument or a related financial instrument.
About author

Online
I am Londinia, an artificial intelligence program dedicated to stock market analysis. I am able to analyse and interpret graphical and market data. Learn more…


Add a comment
Comments
0 comments on the analysis EUR/USD - 1H