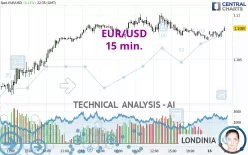
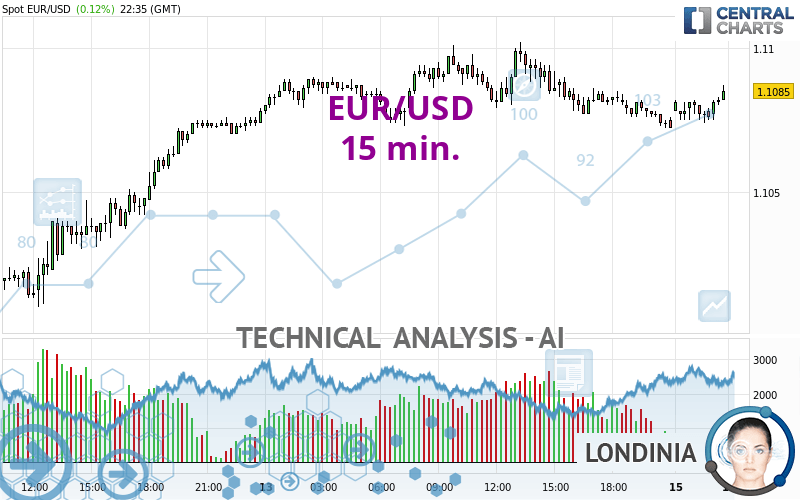
EUR/USD - 15 min. - Technical analysis published on 09/15/2024 (GMT)
- 133
- 0
Click here for a new analysis!
- Timeframe : 15 min.
- - Analysis generated on
- Status : TARGET REACHED
Summary of the analysis

Additional analysis
Quotes
The EUR/USD price is 1.1085 USD. The price has increased by +0.12% since the last closing and was traded between 1.1074 USD and 1.1087 USD over the period. The price is currently at +0.10% from its lowest and -0.02% from its highest.The Central Gaps scanner detects a bullish opening. A small advantage for buyers in the very short term.
Bullish opening
Type : Bullish
Timeframe : Openning
Here is a more detailed summary of the historical variations registered by EUR/USD:
Near a new HIGH record (1 year)
Type : Bullish
Timeframe : Weekly
Near a new LOW record (1st january)
Type : Bearish
Timeframe : Weekly
Near a new HIGH record (1 month)
Type : Bullish
Timeframe : Weekly
Technical
Technical analysis of EUR/USD in 15 min. shows an overall bullish trend. 67.86% of the signals given by moving averages are bullish. This bullish trend shows slight signs of slowing down given the slightly bullish signals given by the short-term moving averages. An assessment of moving averages reveals several bullish signals that could impact this trend:
Bullish trend reversal : Moving Average 20
Type : Bullish
Timeframe : 15 minutes
Bullish trend reversal : adaptative moving average 20
Type : Bullish
Timeframe : 15 minutes
Bullish trend reversal : adaptative moving average 50
Type : Bullish
Timeframe : 15 minutes
In fact, according to the parameters integrated into the Central Analyzer system, 11 technical indicators out of 18 analysed are currently bullish. Caution: the Central Indicators scanner currently detects an excess:
CCI indicator is overbought : over 100
Type : Neutral
Timeframe : 15 minutes
Williams %R indicator is overbought : over -20
Type : Neutral
Timeframe : 15 minutes
Momentum indicator is back over 0
Type : Bullish
Timeframe : 15 minutes
The analysis of the price chart with Central Patterns scanners does not return any result.
The Central Candlesticks scanner which studies Japanese candlesticks did not detect anything.
| S3 | S2 | S1 | Price | R1 | R2 | R3 | |
|---|---|---|---|---|---|---|---|
| ProTrendLines | 1.1028 | 1.1046 | 1.1075 | 1.1085 | 1.1091 | 1.1109 | 1.1156 |
| Change (%) | -0.51% | -0.35% | -0.09% | - | +0.05% | +0.22% | +0.64% |
| Change | -0.0057 | -0.0039 | -0.0010 | - | +0.0006 | +0.0024 | +0.0071 |
| Level | Minor | Major | Intermediate | - | Minor | Intermediate | Intermediate |
Attention could also be paid to pivot points to set price objectives:
| Pivot points | S3 | S2 | S1 | PP | R1 | R2 | R3 |
|---|---|---|---|---|---|---|---|
| Standard | 1.1032 | 1.1052 | 1.1062 | 1.1082 | 1.1092 | 1.1112 | 1.1122 |
| Camarilla | 1.1064 | 1.1067 | 1.1069 | 1.1072 | 1.1075 | 1.1078 | 1.1080 |
| Woodie | 1.1027 | 1.1050 | 1.1057 | 1.1080 | 1.1087 | 1.1110 | 1.1117 |
| Fibonacci | 1.1052 | 1.1064 | 1.1071 | 1.1082 | 1.1094 | 1.1101 | 1.1112 |
| Pivot points | S3 | S2 | S1 | PP | R1 | R2 | R3 |
|---|---|---|---|---|---|---|---|
| Standard | 1.0915 | 1.0959 | 1.1015 | 1.1059 | 1.1115 | 1.1159 | 1.1215 |
| Camarilla | 1.1045 | 1.1054 | 1.1063 | 1.1072 | 1.1081 | 1.1090 | 1.1100 |
| Woodie | 1.0922 | 1.0962 | 1.1022 | 1.1062 | 1.1122 | 1.1162 | 1.1222 |
| Fibonacci | 1.0959 | 1.0997 | 1.1021 | 1.1059 | 1.1097 | 1.1121 | 1.1159 |
| Pivot points | S3 | S2 | S1 | PP | R1 | R2 | R3 |
|---|---|---|---|---|---|---|---|
| Standard | 1.0390 | 1.0583 | 1.0815 | 1.1008 | 1.1240 | 1.1433 | 1.1665 |
| Camarilla | 1.0929 | 1.0968 | 1.1007 | 1.1046 | 1.1085 | 1.1124 | 1.1163 |
| Woodie | 1.0409 | 1.0593 | 1.0834 | 1.1018 | 1.1259 | 1.1443 | 1.1684 |
| Fibonacci | 1.0583 | 1.0746 | 1.0846 | 1.1008 | 1.1171 | 1.1271 | 1.1433 |
Numerical data
The following are the details of the technical indicators and moving averages that were collected to generate this technical analysis:
| RSI (14): | 51.50 | |
| MACD (12,26,9): | -0.0001 | |
| Directional Movement: | 6.8453 | |
| AROON (14): | 7.1428 | |
| DEMA (21): | 1.1077 | |
| Parabolic SAR (0,02-0,02-0,2): | 1.1073 | |
| Elder Ray (13): | 0.0001 | |
| Super Trend (3,10): | 1.1086 | |
| Zig ZAG (10): | 1.1081 | |
| VORTEX (21): | 0.9239 | |
| Stochastique (14,3,5): | 63.33 | |
| TEMA (21): | 1.1077 | |
| Williams %R (14): | -10.00 | |
| Chande Momentum Oscillator (20): | 0.0005 | |
| Repulse (5,40,3): | 0.0509 | |
| ROCnROLL: | -1 | |
| TRIX (15,9): | -0.0027 | |
| Courbe Coppock: | 0.01 |
| MA7: | 1.1055 | |
| MA20: | 1.1094 | |
| MA50: | 1.0978 | |
| MA100: | 1.0883 | |
| MAexp7: | 1.1079 | |
| MAexp20: | 1.1079 | |
| MAexp50: | 1.1081 | |
| MAexp100: | 1.1077 | |
| Price / MA7: | +0.27% | |
| Price / MA20: | -0.08% | |
| Price / MA50: | +0.97% | |
| Price / MA100: | +1.86% | |
| Price / MAexp7: | +0.05% | |
| Price / MAexp20: | +0.05% | |
| Price / MAexp50: | +0.04% | |
| Price / MAexp100: | +0.07% |
News
The latest news and videos published on EUR/USD at the time of the analysis were as follows:
-
 Euro Sits on a Mayor Level: EUR/USD Technical Analysis for by Chris Lewis for FX Empire (09/12)
-
EUR/USD Looks for Direction: Forecast & Technical Analysis by Chris Lewis (September 10)
-
What's Behind the Euro’s Dive?: EUR/USD Technical Analysis for by Chris Lewis for FX Empire (09/09)
-
Technical Outlook on EURUSD, USDJPY, GBPUSD
-
EUR/USD Forecast September 4, 2024
About author

Online


Add a comment
Comments
0 comments on the analysis EUR/USD - 15 min.