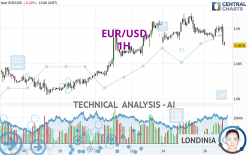
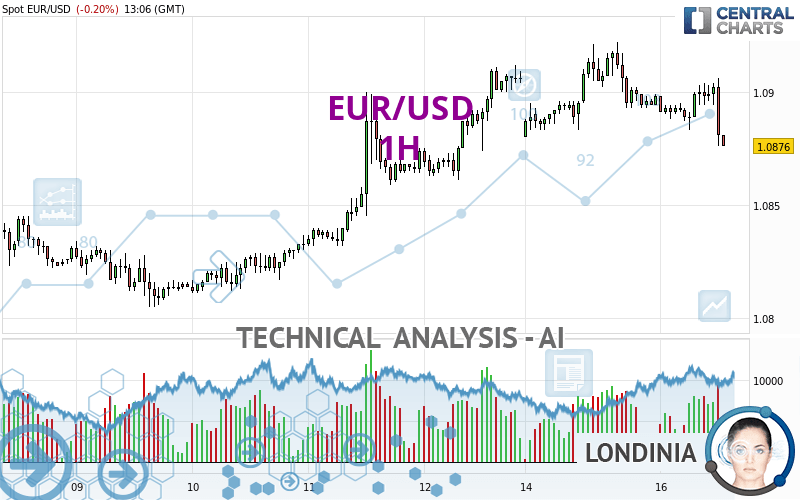
EUR/USD - 1H - Technical analysis published on 07/16/2024 (GMT)
- 163
- 0
Click here for a new analysis!
- Timeframe : 1H
- - Analysis generated on
- Status : INVALID
Summary of the analysis

Additional analysis
Quotes
The EUR/USD price is 1.0876 USD. The price registered a decrease of -0.20% on the session and was traded between 1.0876 USD and 1.0906 USD over the period. The price is currently at 0% from its lowest and -0.28% from its highest.So that you have an overall view of the price change, here is a table showing the variations over several periods:
Near a new LOW record (1 year)
Type : Bearish
Timeframe : Weekly
Near a new LOW record (1st january)
Type : Bearish
Timeframe : Weekly
Near a new LOW record (1 month)
Type : Bearish
Timeframe : Weekly
Technical
Technical analysis of EUR/USD in 1H shows an overall slightly bearish trend. 46.43% of the signals given by moving averages are bearish. This slightly bearish trend could be reinforced by the strong bearish signals given by short-term moving averages. An assessment of moving averages reveals several bearish signals that could impact this trend:
Bearish trend reversal : Moving Average 50
Type : Bearish
Timeframe : 1 hour
Bearish trend reversal : adaptative moving average 20
Type : Bearish
Timeframe : 1 hour
Bearish trend reversal : adaptative moving average 50
Type : Bearish
Timeframe : 1 hour
In fact, 11 technical indicators on 18 studied are currently positioned bearish. Caution: the Central Indicators scanner currently detects an excess:
CCI indicator is oversold : under -100
Type : Neutral
Timeframe : 1 hour
Williams %R indicator is oversold : under -80
Type : Neutral
Timeframe : 1 hour
Pivot points : price is under support 1
Type : Neutral
Timeframe : 1 hour
RSI indicator is back under 50
Type : Bearish
Timeframe : 1 hour
MACD crosses DOWN its Moving Average
Type : Bearish
Timeframe : 1 hour
Parabolic SAR indicator bearish reversal
Type : Bearish
Timeframe : 1 hour
Ichimoku : price is under the cloud
Type : Bearish
Timeframe : 1 hour
SuperTrend indicator bearish reversal
Type : Bearish
Timeframe : 1 hour
MACD indicator is back under 0
Type : Bearish
Timeframe : 1 hour
Momentum indicator is back under 0
Type : Bearish
Timeframe : 1 hour
No signals are given by Central Patterns, a market scanner specialised in chart patterns, resistances and supports.
No result was found by the Central Candlesticks scanner on Japanese candlesticks.
| S3 | S2 | S1 | Price | R1 | R2 | R3 | |
|---|---|---|---|---|---|---|---|
| ProTrendLines | 1.0809 | 1.0843 | 1.0861 | 1.0876 | 1.0883 | 1.0907 | 1.0922 |
| Change (%) | -0.62% | -0.30% | -0.14% | - | +0.06% | +0.29% | +0.42% |
| Change | -0.0067 | -0.0033 | -0.0015 | - | +0.0007 | +0.0031 | +0.0046 |
| Level | Intermediate | Intermediate | Minor | - | Minor | Major | Intermediate |
Attention could also be paid to pivot points to set price objectives:
| Pivot points | S3 | S2 | S1 | PP | R1 | R2 | R3 |
|---|---|---|---|---|---|---|---|
| Standard | 1.0836 | 1.0858 | 1.0878 | 1.0900 | 1.0920 | 1.0942 | 1.0962 |
| Camarilla | 1.0887 | 1.0890 | 1.0894 | 1.0898 | 1.0902 | 1.0906 | 1.0910 |
| Woodie | 1.0835 | 1.0858 | 1.0877 | 1.0900 | 1.0919 | 1.0942 | 1.0961 |
| Fibonacci | 1.0858 | 1.0874 | 1.0884 | 1.0900 | 1.0916 | 1.0926 | 1.0942 |
| Pivot points | S3 | S2 | S1 | PP | R1 | R2 | R3 |
|---|---|---|---|---|---|---|---|
| Standard | 1.0721 | 1.0761 | 1.0833 | 1.0873 | 1.0945 | 1.0985 | 1.1057 |
| Camarilla | 1.0875 | 1.0886 | 1.0896 | 1.0906 | 1.0916 | 1.0927 | 1.0937 |
| Woodie | 1.0738 | 1.0769 | 1.0850 | 1.0881 | 1.0962 | 1.0993 | 1.1074 |
| Fibonacci | 1.0761 | 1.0804 | 1.0830 | 1.0873 | 1.0916 | 1.0942 | 1.0985 |
| Pivot points | S3 | S2 | S1 | PP | R1 | R2 | R3 |
|---|---|---|---|---|---|---|---|
| Standard | 1.0364 | 1.0515 | 1.0614 | 1.0765 | 1.0864 | 1.1015 | 1.1114 |
| Camarilla | 1.0644 | 1.0667 | 1.0690 | 1.0713 | 1.0736 | 1.0759 | 1.0782 |
| Woodie | 1.0338 | 1.0502 | 1.0588 | 1.0752 | 1.0838 | 1.1002 | 1.1088 |
| Fibonacci | 1.0515 | 1.0611 | 1.0670 | 1.0765 | 1.0861 | 1.0920 | 1.1015 |
Numerical data
The following are the details of the technical indicators and moving averages that were collected to generate this technical analysis:
| RSI (14): | 37.38 | |
| MACD (12,26,9): | -0.0002 | |
| Directional Movement: | -11.9565 | |
| AROON (14): | 0 | |
| DEMA (21): | 1.0892 | |
| Parabolic SAR (0,02-0,02-0,2): | 1.0906 | |
| Elder Ray (13): | -0.0013 | |
| Super Trend (3,10): | 1.0908 | |
| Zig ZAG (10): | 1.0878 | |
| VORTEX (21): | 0.8631 | |
| Stochastique (14,3,5): | 39.05 | |
| TEMA (21): | 1.0888 | |
| Williams %R (14): | -93.33 | |
| Chande Momentum Oscillator (20): | -0.0015 | |
| Repulse (5,40,3): | -0.1652 | |
| ROCnROLL: | 2 | |
| TRIX (15,9): | -0.0014 | |
| Courbe Coppock: | 0.08 |
| MA7: | 1.0862 | |
| MA20: | 1.0782 | |
| MA50: | 1.0803 | |
| MA100: | 1.0798 | |
| MAexp7: | 1.0889 | |
| MAexp20: | 1.0894 | |
| MAexp50: | 1.0891 | |
| MAexp100: | 1.0876 | |
| Price / MA7: | +0.13% | |
| Price / MA20: | +0.87% | |
| Price / MA50: | +0.68% | |
| Price / MA100: | +0.72% | |
| Price / MAexp7: | -0.12% | |
| Price / MAexp20: | -0.17% | |
| Price / MAexp50: | -0.14% | |
| Price / MAexp100: | -0% |
News
The last news published on EUR/USD at the time of the generation of this analysis was as follows:
-
 EUR/USD Daily Forecast and Technical Analysis for July 15, 2024, by Chris Lewis for FX Empire
-
EUR/USD Long Term Forecast and Technical Analysis for July 12, 2024, by Chris Lewis for FX Empire
-
EUR/USD Daily Forecast and Technical Analysis for July 12, 2024, by Chris Lewis for FX Empire
-
EUR/USD Forecast July 12, 2024
-
EUR/USD Daily Forecast and Technical Analysis for July 11, 2024, by Chris Lewis for FX Empire
About author

Online


Add a comment
Comments
0 comments on the analysis EUR/USD - 1H