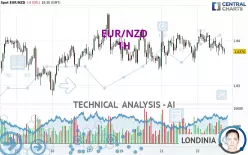
EUR/NZD - 1H - Technical analysis published on 01/22/2025 (GMT)
- 123
- 0
Click here for a new analysis!
- Timeframe : 1H
- - Analysis generated on
- Status : TARGET REACHED

Summary of the analysis

Additional analysis
Quotes
The EUR/NZD rating is 1.8376 NZD. The price registered a decrease of -0.03% on the session with the lowest point at 1.8367 NZD and the highest point at 1.8424 NZD. The deviation from the price is +0.05% for the low point and -0.26% for the high point.A bullish opening was detected by the Central Gaps scanner. Buyers are trying to impose a bullish momentum in the very short term.
Bullish opening
Type : Bullish
Timeframe : Openning
A study of price movements over other periods shows the following variations:
Near a new HIGH record (1 year)
Type : Bullish
Timeframe : Weekly
Near a new HIGH record (1st january)
Type : Bullish
Timeframe : Weekly
Near a new HIGH record (1 month)
Type : Bullish
Timeframe : Weekly
Technical
Technical analysis of EUR/NZD in 1H shows an overall slightly bearish trend. Only 57.14% of the signals given by moving averages are bearish. This slightly bearish trend is not supported by the signals currently being given by short-term moving averages. The Central Indicators market scanner is currently detecting several bearish signals that could impact this trend:
Bearish trend reversal : Moving Average 50
Type : Bearish
Timeframe : 1 hour
Bearish trend reversal : adaptative moving average 100
Type : Bearish
Timeframe : 1 hour
Bearish price crossover with adaptative moving average 50
Type : Bearish
Timeframe : 1 hour
The technical indicators are generally neutral. They do not provide relevant information on the direction of future price movements.
Caution: the Central Indicators scanner currently detects an excess:
CCI indicator is oversold : under -100
Type : Neutral
Timeframe : 1 hour
Williams %R indicator is oversold : under -80
Type : Neutral
Timeframe : 1 hour
Price is back under the pivot point
Type : Bearish
Timeframe : 1 hour
An analysis of the price chart with the Central Patterns scanner (detector of chart patterns and resistances and supports) shows a result that can have an impact on the price change:
Near support of channel
Type : Bullish
Timeframe : 1 hour
The Central Candlesticks scanner, specialised in Japanese candlesticks, did not identify any signals.
| S3 | S2 | S1 | Price | R1 | R2 | R3 | |
|---|---|---|---|---|---|---|---|
| ProTrendLines | 1.8279 | 1.8335 | 1.8357 | 1.8376 | 1.8389 | 1.8408 | 1.8442 |
| Change (%) | -0.53% | -0.22% | -0.10% | - | +0.07% | +0.17% | +0.36% |
| Change | -0.0097 | -0.0041 | -0.0019 | - | +0.0013 | +0.0032 | +0.0066 |
| Level | Intermediate | Intermediate | Minor | - | Minor | Intermediate | Major |
To determine price objectives, it is also possible to use the pivot points. Here is the price position in relation to pivot points:
| Pivot points | S3 | S2 | S1 | PP | R1 | R2 | R3 |
|---|---|---|---|---|---|---|---|
| Standard | 1.8253 | 1.8295 | 1.8338 | 1.8380 | 1.8423 | 1.8465 | 1.8508 |
| Camarilla | 1.8359 | 1.8366 | 1.8374 | 1.8382 | 1.8390 | 1.8398 | 1.8405 |
| Woodie | 1.8255 | 1.8295 | 1.8340 | 1.8380 | 1.8425 | 1.8465 | 1.8510 |
| Fibonacci | 1.8295 | 1.8327 | 1.8347 | 1.8380 | 1.8412 | 1.8432 | 1.8465 |
| Pivot points | S3 | S2 | S1 | PP | R1 | R2 | R3 |
|---|---|---|---|---|---|---|---|
| Standard | 1.8033 | 1.8132 | 1.8264 | 1.8363 | 1.8495 | 1.8594 | 1.8726 |
| Camarilla | 1.8334 | 1.8355 | 1.8376 | 1.8397 | 1.8418 | 1.8439 | 1.8461 |
| Woodie | 1.8051 | 1.8140 | 1.8282 | 1.8371 | 1.8513 | 1.8602 | 1.8744 |
| Fibonacci | 1.8132 | 1.8220 | 1.8274 | 1.8363 | 1.8451 | 1.8505 | 1.8594 |
| Pivot points | S3 | S2 | S1 | PP | R1 | R2 | R3 |
|---|---|---|---|---|---|---|---|
| Standard | 1.7256 | 1.7521 | 1.8012 | 1.8277 | 1.8768 | 1.9033 | 1.9524 |
| Camarilla | 1.8294 | 1.8363 | 1.8433 | 1.8502 | 1.8571 | 1.8641 | 1.8710 |
| Woodie | 1.7368 | 1.7578 | 1.8124 | 1.8334 | 1.8880 | 1.9090 | 1.9636 |
| Fibonacci | 1.7521 | 1.7810 | 1.7989 | 1.8277 | 1.8566 | 1.8745 | 1.9033 |
Numerical data
The following is the status of technical indicators and moving averages registered at the time this technical analysis was created:
| RSI (14): | 43.56 | |
| MACD (12,26,9): | -0.0002 | |
| Directional Movement: | -6.0025 | |
| AROON (14): | -57.1429 | |
| DEMA (21): | 1.8389 | |
| Parabolic SAR (0,02-0,02-0,2): | 1.8420 | |
| Elder Ray (13): | -0.0009 | |
| Super Trend (3,10): | 1.8424 | |
| Zig ZAG (10): | 1.8378 | |
| VORTEX (21): | 1.0512 | |
| Stochastique (14,3,5): | 26.80 | |
| TEMA (21): | 1.8384 | |
| Williams %R (14): | -86.27 | |
| Chande Momentum Oscillator (20): | -0.0034 | |
| Repulse (5,40,3): | -0.0951 | |
| ROCnROLL: | 2 | |
| TRIX (15,9): | 0.0004 | |
| Courbe Coppock: | 0.18 |
| MA7: | 1.8365 | |
| MA20: | 1.8401 | |
| MA50: | 1.8194 | |
| MA100: | 1.8055 | |
| MAexp7: | 1.8384 | |
| MAexp20: | 1.8391 | |
| MAexp50: | 1.8389 | |
| MAexp100: | 1.8385 | |
| Price / MA7: | +0.06% | |
| Price / MA20: | -0.14% | |
| Price / MA50: | +1.00% | |
| Price / MA100: | +1.78% | |
| Price / MAexp7: | -0.04% | |
| Price / MAexp20: | -0.08% | |
| Price / MAexp50: | -0.07% | |
| Price / MAexp100: | -0.05% |
News
Don't forget to follow the news on EUR/NZD. At the time of publication of this analysis, the latest news was as follows:
-
 EUR/NZD Forecast November 18, 2024
-
EUR/NZD Forecast September 13, 2024
-
EUR/NZD Forecast September 4, 2024
-
EUR/NZD Forecast August 19, 2024
-
EUR/NZD Forecast June 7, 2024
About author
Online


Add a comment
Comments
0 comments on the analysis EUR/NZD - 1H