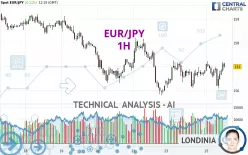
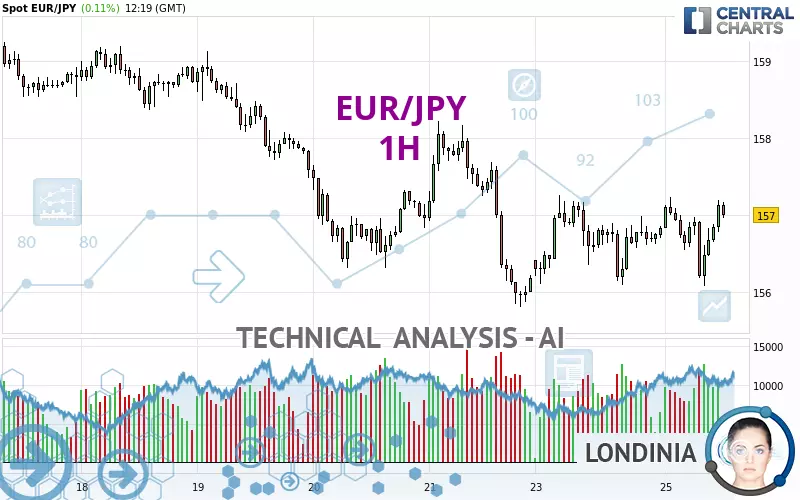
EUR/JPY - 1H - Technical analysis published on 02/25/2025 (GMT)
- 53
- 0
Click here for a new analysis!
- Timeframe : 1H
- - Analysis generated on
- Status : LEVEL MAINTAINED
Summary of the analysis

Additional analysis
Quotes
The EUR/JPY price is 157.01 JPY. On the day, this instrument gained +0.12% and was traded between 156.08 JPY and 157.24 JPY over the period. The price is currently at +0.60% from its lowest and -0.15% from its highest.A study of price movements over other periods shows the following variations:
Near a new LOW record (1 year)
Type : Bearish
Timeframe : Weekly
Near a new HIGH record (1st january)
Type : Bullish
Timeframe : Weekly
Near a new HIGH record (1 month)
Type : Bullish
Timeframe : Weekly
Technical
A technical analysis in 1H of this EUR/JPY chart shows a slightly bearish trend. Only 53.57% of the signals given by moving averages are bearish. This slightly bearish trend could quickly be reversed due to the strong bullish signals currently being given by short-term moving averages. There is no crossing of moving average by the price or crossing of moving averages between themselves.
Technical indicators are strongly bullish, suggesting that the price increase should continue.
Caution: the Central Indicators scanner currently detects an excess:
CCI indicator is overbought : over 100
Type : Neutral
Timeframe : 1 hour
Williams %R indicator is overbought : over -20
Type : Neutral
Timeframe : 1 hour
An analysis of the price chart with the Central Patterns scanner (detector of chart patterns and resistances and supports) shows a result that can have an impact on the price change:
Near resistance of channel
Type : Bearish
Timeframe : 1 hour
The Central Candlesticks scanner which studies Japanese candlesticks did not detect anything.
| S3 | S2 | S1 | R1 | Price | R2 | R3 | |
|---|---|---|---|---|---|---|---|
| ProTrendLines | 149.26 | 155.81 | 156.32 | 157.01 | 157.01 | 158.21 | 159.17 |
| Change (%) | -4.94% | -0.76% | -0.44% | 0% | - | +0.76% | +1.38% |
| Change | -7.75 | -1.20 | -0.69 | 0 | - | +1.20 | +2.16 |
| Level | Intermediate | Intermediate | Intermediate | Major | - | Intermediate | Intermediate |
To determine price objectives, it is also possible to use the pivot points. Here is the price position in relation to pivot points:
| Pivot points | S3 | S2 | S1 | PP | R1 | R2 | R3 |
|---|---|---|---|---|---|---|---|
| Standard | 155.02 | 155.56 | 156.19 | 156.73 | 157.36 | 157.90 | 158.53 |
| Camarilla | 156.51 | 156.62 | 156.72 | 156.83 | 156.94 | 157.05 | 157.15 |
| Woodie | 155.08 | 155.58 | 156.25 | 156.75 | 157.42 | 157.92 | 158.59 |
| Fibonacci | 155.56 | 156.00 | 156.28 | 156.73 | 157.17 | 157.45 | 157.90 |
| Pivot points | S3 | S2 | S1 | PP | R1 | R2 | R3 |
|---|---|---|---|---|---|---|---|
| Standard | 150.68 | 153.25 | 154.71 | 157.28 | 158.74 | 161.31 | 162.77 |
| Camarilla | 155.07 | 155.44 | 155.81 | 156.18 | 156.55 | 156.92 | 157.29 |
| Woodie | 150.14 | 152.97 | 154.17 | 157.00 | 158.20 | 161.03 | 162.23 |
| Fibonacci | 153.25 | 154.79 | 155.74 | 157.28 | 158.82 | 159.77 | 161.31 |
| Pivot points | S3 | S2 | S1 | PP | R1 | R2 | R3 |
|---|---|---|---|---|---|---|---|
| Standard | 154.03 | 156.88 | 158.85 | 161.70 | 163.67 | 166.52 | 168.49 |
| Camarilla | 159.50 | 159.94 | 160.38 | 160.82 | 161.26 | 161.70 | 162.15 |
| Woodie | 153.59 | 156.66 | 158.41 | 161.48 | 163.23 | 166.30 | 168.05 |
| Fibonacci | 156.88 | 158.72 | 159.86 | 161.70 | 163.54 | 164.68 | 166.52 |
Numerical data
The following is the status of the technical indicators and moving averages at the time of publication of this technical analysis:
| RSI (14): | 56.83 | |
| MACD (12,26,9): | 0.0400 | |
| Directional Movement: | 2.17 | |
| AROON (14): | -50.00 | |
| DEMA (21): | 156.83 | |
| Parabolic SAR (0,02-0,02-0,2): | 156.10 | |
| Elder Ray (13): | 0.31 | |
| Super Trend (3,10): | 157.27 | |
| Zig ZAG (10): | 157.12 | |
| VORTEX (21): | 1.1600 | |
| Stochastique (14,3,5): | 82.47 | |
| TEMA (21): | 156.90 | |
| Williams %R (14): | -10.34 | |
| Chande Momentum Oscillator (20): | 0.00 | |
| Repulse (5,40,3): | 0.2000 | |
| ROCnROLL: | 1 | |
| TRIX (15,9): | 0.0000 | |
| Courbe Coppock: | 0.06 |
| MA7: | 157.46 | |
| MA20: | 158.61 | |
| MA50: | 160.91 | |
| MA100: | 161.71 | |
| MAexp7: | 156.88 | |
| MAexp20: | 156.80 | |
| MAexp50: | 156.85 | |
| MAexp100: | 157.16 | |
| Price / MA7: | -0.29% | |
| Price / MA20: | -1.01% | |
| Price / MA50: | -2.42% | |
| Price / MA100: | -2.91% | |
| Price / MAexp7: | +0.08% | |
| Price / MAexp20: | +0.13% | |
| Price / MAexp50: | +0.10% | |
| Price / MAexp100: | -0.10% |
News
The last news published on EUR/JPY at the time of the generation of this analysis was as follows:
-
 EUR/JPY Price Forecast - Can the Euro Climb Against the Lowly Yen?
-
EUR/JPY Price Forecast - Euro Rallies Against the Lowly Yen
-
EUR/JPY Forecast December 16, 2024
-
EUR/JPY Forecast November 20, 2024
-
EUR/JPY Forecast November 13, 2024
About author

Online


Add a comment
Comments
0 comments on the analysis EUR/JPY - 1H