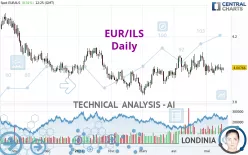
EUR/ILS - Daily - Technical analysis published on 05/16/2024 (GMT)
- 123
- 0
Click here for a new analysis!
- Timeframe : Daily
- - Analysis generated on
- Status : LEVEL MAINTAINED

Summary of the analysis

Additional analysis
Quotes
The EUR/ILS rating is 4.00766 ILS. On the day, this instrument gained +0.31% with the lowest point at 3.98956 ILS and the highest point at 4.00910 ILS. The deviation from the price is +0.45% for the low point and -0.04% for the high point.Here is a more detailed summary of the historical variations registered by EUR/ILS:
Near a new LOW record (1 year)
Type : Bearish
Timeframe : Weekly
Near a new LOW record (1st january)
Type : Bearish
Timeframe : Weekly
Near a new HIGH record (1 month)
Type : Bullish
Timeframe : Weekly
Technical
Technical analysis of EUR/ILS in Daily shows an overall bullish trend. 67.86% of the signals given by moving averages are bullish. This bullish trend shows slight signs of slowing down given the slightly bullish signals given by the short-term moving averages. The Central Indicators scanner detects bullish and bearish signals on moving averages that could impact this trend:
Bearish trend reversal : Moving Average 20
Type : Bearish
Timeframe : Daily
Bearish trend reversal : Moving Average 100
Type : Bearish
Timeframe : Daily
Bullish price crossover with Moving Average 50
Type : Bullish
Timeframe : Daily
Bullish price crossover with adaptative moving average 50
Type : Bullish
Timeframe : Daily
An assessment of technical indicators does not currently provide any relevant information on the direction of future price movements.
Other results related to technical indicators were also found by the Central Indicators scanner:
RSI indicator is back over 50
Type : Bullish
Timeframe : Daily
Ichimoku : price is over the cloud
Type : Bullish
Timeframe : Daily
Price is back over the pivot point
Type : Bullish
Timeframe : Weekly
Momentum indicator is back over 0
Type : Bullish
Timeframe : Daily
An analysis of the price chart with the Central Patterns scanner (detector of chart patterns and resistances and supports) shows several results that can have an impact on the price change:
Near horizontal resistance
Type : Bearish
Timeframe : Daily
Near support of triangle
Type : Bullish
Timeframe : Daily
The Central Candlesticks scanner, specialised in Japanese candlesticks, did not identify any signals.
| S3 | S2 | S1 | Price | R1 | R2 | R3 | |
|---|---|---|---|---|---|---|---|
| ProTrendLines | 3.68995 | 3.85450 | 3.92602 | 4.00766 | 4.00827 | 4.07922 | 4.12783 |
| Change (%) | -7.93% | -3.82% | -2.04% | - | +0.02% | +1.79% | +3.00% |
| Change | -0.31771 | -0.15316 | -0.08164 | - | +0.00061 | +0.07156 | +0.12017 |
| Level | Major | Major | Minor | - | Major | Intermediate | Intermediate |
Pivot points can also be used to set your price objectives. Here is the price situation in relation to pivot points:
| Pivot points | S3 | S2 | S1 | PP | R1 | R2 | R3 |
|---|---|---|---|---|---|---|---|
| Standard | 3.94581 | 3.96191 | 3.97852 | 3.99462 | 4.01123 | 4.02733 | 4.04394 |
| Camarilla | 3.98614 | 3.98913 | 3.99213 | 3.99513 | 3.99813 | 4.00113 | 4.00413 |
| Woodie | 3.94607 | 3.96204 | 3.97878 | 3.99475 | 4.01149 | 4.02746 | 4.04420 |
| Fibonacci | 3.96191 | 3.97441 | 3.98213 | 3.99462 | 4.00712 | 4.01484 | 4.02733 |
| Pivot points | S3 | S2 | S1 | PP | R1 | R2 | R3 |
|---|---|---|---|---|---|---|---|
| Standard | 3.89089 | 3.92785 | 3.96550 | 4.00246 | 4.04011 | 4.07707 | 4.11472 |
| Camarilla | 3.98262 | 3.98946 | 3.99630 | 4.00314 | 4.00998 | 4.01682 | 4.02366 |
| Woodie | 3.89123 | 3.92802 | 3.96584 | 4.00263 | 4.04045 | 4.07724 | 4.11506 |
| Fibonacci | 3.92785 | 3.95635 | 3.97396 | 4.00246 | 4.03096 | 4.04857 | 4.07707 |
| Pivot points | S3 | S2 | S1 | PP | R1 | R2 | R3 |
|---|---|---|---|---|---|---|---|
| Standard | 3.75658 | 3.84973 | 3.91826 | 4.01141 | 4.07994 | 4.17309 | 4.24162 |
| Camarilla | 3.94233 | 3.95715 | 3.97197 | 3.98679 | 4.00161 | 4.01643 | 4.03125 |
| Woodie | 3.74427 | 3.84358 | 3.90595 | 4.00526 | 4.06763 | 4.16694 | 4.22931 |
| Fibonacci | 3.84973 | 3.91149 | 3.94965 | 4.01141 | 4.07317 | 4.11133 | 4.17309 |
Numerical data
The following is the status of technical indicators and moving averages registered at the time this technical analysis was created:
| RSI (14): | 50.00 | |
| MACD (12,26,9): | -0.0012 | |
| Directional Movement: | -0.16430 | |
| AROON (14): | -14.28571 | |
| DEMA (21): | 4.00641 | |
| Parabolic SAR (0,02-0,02-0,2): | 4.07396 | |
| Elder Ray (13): | -0.00596 | |
| Super Trend (3,10): | 3.93113 | |
| Zig ZAG (10): | 4.00572 | |
| VORTEX (21): | 1.0031 | |
| Stochastique (14,3,5): | 29.14 | |
| TEMA (21): | 3.99771 | |
| Williams %R (14): | -60.56 | |
| Chande Momentum Oscillator (20): | 0.01869 | |
| Repulse (5,40,3): | 0.1152 | |
| ROCnROLL: | 1 | |
| TRIX (15,9): | 0.0050 | |
| Courbe Coppock: | 1.79 |
| MA7: | 4.00266 | |
| MA20: | 4.01257 | |
| MA50: | 3.99938 | |
| MA100: | 3.99099 | |
| MAexp7: | 4.00190 | |
| MAexp20: | 4.00573 | |
| MAexp50: | 3.99990 | |
| MAexp100: | 4.00340 | |
| Price / MA7: | +0.12% | |
| Price / MA20: | -0.12% | |
| Price / MA50: | +0.21% | |
| Price / MA100: | +0.42% | |
| Price / MAexp7: | +0.14% | |
| Price / MAexp20: | +0.05% | |
| Price / MAexp50: | +0.19% | |
| Price / MAexp100: | +0.11% |
About author

Online


Add a comment
Comments
0 comments on the analysis EUR/ILS - Daily