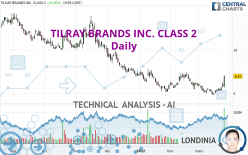
TILRAY BRANDS INC. - Daily - Technical analysis published on 03/25/2022 (GMT)
- 271
- 0
Click here for a new analysis!
- Timeframe : Daily
- - Analysis generated on
- Status : TARGET REACHED
Summary of the analysis

Additional analysis
Quotes
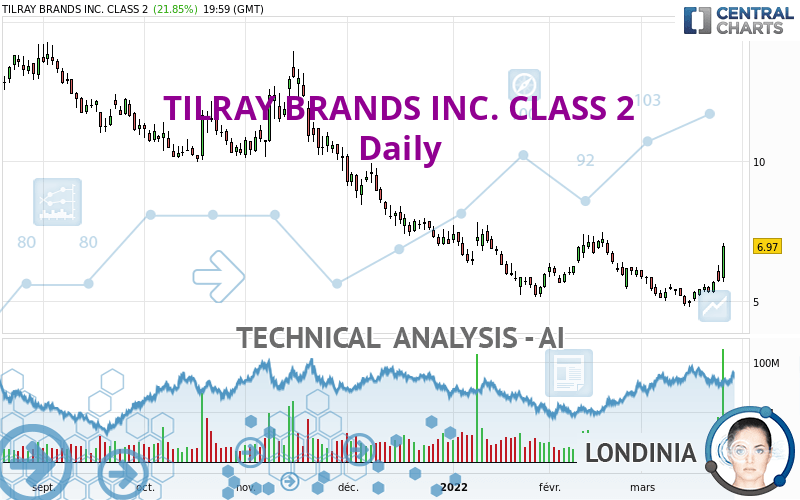
The TILRAY BRANDS INC. CLASS 2 rating is 6.97 USD. On the day, this instrument gained +21.85% and was between 5.68 USD and 7.07 USD. This implies that the price is at +22.71% from its lowest and at -1.41% from its highest.So that you have an overall view of the price change, here is a table showing the variations over several periods:
New HIGH record (1 month)
Type : Bullish
Timeframe : Weekly
Technical
A technical analysis in Daily of this TILRAY BRANDS INC. CLASS 2 chart shows a slightly bearish trend. 57.14% of the signals given by moving averages are bearish. Caution: the strong bullish signals currently being given by short-term moving averages could quickly lead to a reversal of the trend. The Central Indicators scanner detects bullish signals on moving averages that could impact this trend:
Bullish price crossover with Moving Average 50
Type : Bullish
Timeframe : Daily
Bullish price crossover with adaptative moving average 20
Type : Bullish
Timeframe : Daily
Bullish price crossover with adaptative moving average 50
Type : Bullish
Timeframe : Daily
Bullish price crossover with adaptative moving average 100
Type : Bullish
Timeframe : Daily
In fact, 11 technical indicators on 18 studied are currently bullish. Caution: the Central Indicators scanner currently detects an excess:
CCI indicator is overbought : over 100
Type : Neutral
Timeframe : Daily
Williams %R indicator is overbought : over -20
Type : Neutral
Timeframe : Daily
Pivot points : price is over resistance 3
Type : Neutral
Timeframe : Daily
Pivot points : price is over resistance 3
Type : Neutral
Timeframe : Weekly
SuperTrend indicator bullish reversal
Type : Bullish
Timeframe : Daily
Central Patterns, the scanner specializing in chart patterns, did not identify any signals.
Central Candlesticks, the scanner specialised in Japanese candlesticks, detects a bullish signal that could support the hypothesis of a small rebound in the very short term:
Long white line
Type : Bullish
Timeframe : Daily
| S1 | Price | R1 | R2 | R3 | |
|---|---|---|---|---|---|
| ProTrendLines | 5.21 | 6.97 | 7.24 | 10.08 | 13.36 |
| Change (%) | -25.25% | - | +3.87% | +44.62% | +91.68% |
| Change | -1.76 | - | +0.27 | +3.11 | +6.39 |
| Level | Major | - | Minor | Intermediate | Intermediate |
To determine price objectives, it is also possible to use the pivot points. Here is the price position in relation to pivot points:
| Pivot points | S3 | S2 | S1 | PP | R1 | R2 | R3 |
|---|---|---|---|---|---|---|---|
| Standard | 4.69 | 5.18 | 6.08 | 6.57 | 7.47 | 7.96 | 8.86 |
| Camarilla | 6.59 | 6.72 | 6.84 | 6.97 | 7.10 | 7.23 | 7.35 |
| Woodie | 4.89 | 5.28 | 6.28 | 6.67 | 7.67 | 8.06 | 9.06 |
| Fibonacci | 5.18 | 5.71 | 6.04 | 6.57 | 7.10 | 7.43 | 7.96 |
| Pivot points | S3 | S2 | S1 | PP | R1 | R2 | R3 |
|---|---|---|---|---|---|---|---|
| Standard | 4.17 | 4.48 | 4.99 | 5.30 | 5.81 | 6.12 | 6.63 |
| Camarilla | 5.29 | 5.36 | 5.44 | 5.51 | 5.59 | 5.66 | 5.74 |
| Woodie | 4.28 | 4.53 | 5.10 | 5.35 | 5.92 | 6.17 | 6.74 |
| Fibonacci | 4.48 | 4.79 | 4.98 | 5.30 | 5.61 | 5.80 | 6.12 |
| Pivot points | S3 | S2 | S1 | PP | R1 | R2 | R3 |
|---|---|---|---|---|---|---|---|
| Standard | 3.14 | 4.29 | 5.19 | 6.34 | 7.24 | 8.39 | 9.29 |
| Camarilla | 5.54 | 5.72 | 5.91 | 6.10 | 6.29 | 6.48 | 6.66 |
| Woodie | 3.03 | 4.23 | 5.08 | 6.28 | 7.13 | 8.33 | 9.18 |
| Fibonacci | 4.29 | 5.07 | 5.55 | 6.34 | 7.12 | 7.60 | 8.39 |
Numerical data
The following is the status of technical indicators and moving averages registered at the time this technical analysis was created:
| RSI (14): | 66.33 | |
| MACD (12,26,9): | -0.0700 | |
| Directional Movement: | 16.84 | |
| AROON (14): | 50.00 | |
| DEMA (21): | 5.55 | |
| Parabolic SAR (0,02-0,02-0,2): | 5.02 | |
| Elder Ray (13): | 0.68 | |
| Super Trend (3,10): | 4.91 | |
| Zig ZAG (10): | 6.97 | |
| VORTEX (21): | 0.9600 | |
| Stochastique (14,3,5): | 80.27 | |
| TEMA (21): | 5.75 | |
| Williams %R (14): | -4.37 | |
| Chande Momentum Oscillator (20): | 1.67 | |
| Repulse (5,40,3): | 19.5200 | |
| ROCnROLL: | 1 | |
| TRIX (15,9): | -0.5800 | |
| Courbe Coppock: | 5.30 |
| MA7: | 5.71 | |
| MA20: | 5.54 | |
| MA50: | 5.98 | |
| MA100: | 7.66 | |
| MAexp7: | 5.86 | |
| MAexp20: | 5.71 | |
| MAexp50: | 6.24 | |
| MAexp100: | 7.60 | |
| Price / MA7: | +22.07% | |
| Price / MA20: | +25.81% | |
| Price / MA50: | +16.56% | |
| Price / MA100: | -9.01% | |
| Price / MAexp7: | +18.94% | |
| Price / MAexp20: | +22.07% | |
| Price / MAexp50: | +11.70% | |
| Price / MAexp100: | -8.29% |
News
The last news published on TILRAY BRANDS INC. CLASS 2 at the time of the generation of this analysis was as follows:
- Solei Brand Launches New Wellness Product For Nighttime Use
- Tilray Medical Expands Offering in Malta and Launches First Medical Cannabis Oil Products in Market
- Good Supply Brand Expands Its Award-Winning Cannabis Portfolio with Hash Bats™; A New ‘Hard-Hitting’ Infused Pre-Roll
- Tilray Brands Announces Proposed Agreement for Strategic Alliance With Hexo Corp.
- Manitoba Harvest to Unveil New Superfood Lineup
About author

Online


Add a comment
Comments
0 comments on the analysis TILRAY BRANDS INC. - Daily