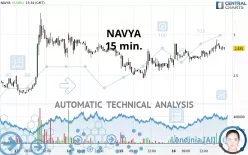
NAVYA - 15 min. - Technical analysis published on 10/17/2020 (GMT)
- 441
- 0
- Who voted?
Click here for a new analysis!
- Timeframe : 15 min.
- - Analysis generated on
- Status : TARGET REACHED

Summary of the analysis
Additional analysis
Quotes
The NAVYA price is 2.835 EUR. The price registered an increase of +6.58% on the session with the lowest point at 2.600 EUR and the highest point at 2.945 EUR. The deviation from the price is +9.04% for the low point and -3.74% for the high point.Here is a more detailed summary of the historical variations registered by NAVYA:
Abnormal volumes
Timeframe : 5 days
Abnormal volumes
Timeframe : 20 days
Abnormal volumes
Timeframe : 50 days
Technical
A technical analysis in 15 min. of this NAVYA chart shows a strongly bullish trend. The signals given by the moving averages are 82.14% bullish. This strong bullish trend is confirmed by the strong signals currently being given by short-term moving averages. There is no crossing of moving average by the price or crossing of moving averages between themselves.
In fact, 10 technical indicators on 18 studied are currently positioned bullish. But beware of excesses. The Central Indicators scanner currently detects this:
Williams %R indicator is overbought : over -20
Type : Neutral
Timeframe : 15 minutes
Pivot points : price is over resistance 2
Type : Neutral
Timeframe : Weekly
Williams %R indicator is back over -50
Type : Bullish
Timeframe : 15 minutes
An analysis of the price chart with the Central Patterns scanner (detector of chart patterns and resistances and supports) shows several results that can have an impact on the price change:
Near horizontal resistance
Type : Bearish
Timeframe : 15 minutes
Near support of triangle
Type : Bullish
Timeframe : 15 minutes
No result was found by the Central Candlesticks scanner on Japanese candlesticks.
| S3 | S2 | S1 | Price | R1 | R2 | R3 | |
|---|---|---|---|---|---|---|---|
| ProTrendLines | 2.290 | 2.560 | 2.720 | 2.835 | 2.890 | 3.030 | 3.270 |
| Change (%) | -19.22% | -9.70% | -4.06% | - | +1.94% | +6.88% | +15.34% |
| Change | -0.545 | -0.275 | -0.115 | - | +0.055 | +0.195 | +0.435 |
| Level | Intermediate | Major | Minor | - | Minor | Minor | Major |
Attention could also be paid to pivot points to set price objectives:
| Pivot points | S3 | S2 | S1 | PP | R1 | R2 | R3 |
|---|---|---|---|---|---|---|---|
| Standard | 2.100 | 2.280 | 2.470 | 2.650 | 2.840 | 3.020 | 3.210 |
| Camarilla | 2.558 | 2.592 | 2.626 | 2.660 | 2.694 | 2.728 | 2.762 |
| Woodie | 2.105 | 2.283 | 2.475 | 2.653 | 2.845 | 3.023 | 3.215 |
| Fibonacci | 2.280 | 2.421 | 2.509 | 2.650 | 2.791 | 2.879 | 3.020 |
| Pivot points | S3 | S2 | S1 | PP | R1 | R2 | R3 |
|---|---|---|---|---|---|---|---|
| Standard | 1.070 | 1.390 | 1.750 | 2.070 | 2.430 | 2.750 | 3.110 |
| Camarilla | 1.923 | 1.985 | 2.048 | 2.110 | 2.172 | 2.235 | 2.297 |
| Woodie | 1.090 | 1.400 | 1.770 | 2.080 | 2.450 | 2.760 | 3.130 |
| Fibonacci | 1.390 | 1.650 | 1.810 | 2.070 | 2.330 | 2.490 | 2.750 |
| Pivot points | S3 | S2 | S1 | PP | R1 | R2 | R3 |
|---|---|---|---|---|---|---|---|
| Standard | -0.047 | 0.769 | 1.254 | 2.070 | 2.555 | 3.371 | 3.856 |
| Camarilla | 1.382 | 1.502 | 1.621 | 1.740 | 1.859 | 1.979 | 2.098 |
| Woodie | -0.212 | 0.686 | 1.090 | 1.987 | 2.391 | 3.288 | 3.692 |
| Fibonacci | 0.769 | 1.266 | 1.573 | 2.070 | 2.567 | 2.874 | 3.371 |
Numerical data
The following is the status of the technical indicators and moving averages at the time of publication of this technical analysis:
| RSI (14): | 55.20 | |
| MACD (12,26,9): | 0.0330 | |
| Directional Movement: | 9.451 | |
| AROON (14): | 42.857 | |
| DEMA (21): | 2.857 | |
| Parabolic SAR (0,02-0,02-0,2): | 2.769 | |
| Elder Ray (13): | 0.005 | |
| Super Trend (3,10): | 2.704 | |
| Zig ZAG (10): | 2.835 | |
| VORTEX (21): | 1.0810 | |
| Stochastique (14,3,5): | 50.37 | |
| TEMA (21): | 2.866 | |
| Williams %R (14): | -48.89 | |
| Chande Momentum Oscillator (20): | 0.080 | |
| Repulse (5,40,3): | -0.0930 | |
| ROCnROLL: | 1 | |
| TRIX (15,9): | 0.1840 | |
| Courbe Coppock: | 6.73 |
| MA7: | 2.543 | |
| MA20: | 2.077 | |
| MA50: | 2.167 | |
| MA100: | 1.703 | |
| MAexp7: | 2.842 | |
| MAexp20: | 2.813 | |
| MAexp50: | 2.764 | |
| MAexp100: | 2.715 | |
| Price / MA7: | +11.48% | |
| Price / MA20: | +36.49% | |
| Price / MA50: | +30.83% | |
| Price / MA100: | +66.47% | |
| Price / MAexp7: | -0.25% | |
| Price / MAexp20: | +0.78% | |
| Price / MAexp50: | +2.57% | |
| Price / MAexp100: | +4.42% |
News
Don"t forget to follow the news on NAVYA. At the time of publication of this analysis, the latest news was as follows:
- Navya Reports Its H1 2020 Results: Improvement in Cash Position and Strengthening of Technological Investments
- Navya Will Publish Its Half-year Results on 23 September 2020 and Will Hold a Conference Call on the Same Day at 6 pm (paris Time)
- Navya Obtains Non-dilutive Loan Facility of €4.5m Guaranteed by the French State
- NAVYA: Half-year Report on Liquidity Contract With Natixis ODDO BHF
- Navya Reaches a New Milestone in Autonomous Mobility With the First Fully Autonomous Level 4 Operation on a Closed Site
About author

Online


Add a comment
Comments
0 comments on the analysis NAVYA - 15 min.