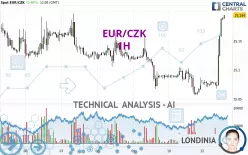
EUR/CZK - 1H - Technical analysis published on 01/13/2025 (GMT)
- 66
- 0
Click here for a new analysis!
- Timeframe : 1H
- - Analysis generated on
- Status : LEVEL MAINTAINED

Summary of the analysis

Additional analysis
Quotes
EUR/CZK rating 25.1940 CZK. On the day, this instrument gained +0.48% and was between 25.0676 CZK and 25.1944 CZK. This implies that the price is at +0.50% from its lowest and at +0.00% from its highest.The Central Gaps scanner detects a bullish opening marking the presence of buyers ahead of sellers at the opening but not sufficiently marked to allow the price to register a quotation gap.
Bullish opening
Type : Bullish
Timeframe : Openning
So that you have an overall view of the price change, here is a table showing the variations over several periods:
Near a new LOW record (1 year)
Type : Bearish
Timeframe : Weekly
Near a new HIGH record (1st january)
Type : Bullish
Timeframe : Weekly
Near a new HIGH record (1 month)
Type : Bullish
Timeframe : Weekly
Technical
A technical analysis in 1H of this EUR/CZK chart shows a bullish trend. The signals returned by the moving averages are 78.57% bullish. This bullish trend is reinforced by the strong signals currently being given by short-term moving averages. There is no crossing of moving average by the price or crossing of moving averages between themselves.
Technical indicators are strongly bullish, suggesting that the price increase should continue.
Caution: the Central Indicators scanner currently detects an excess:
RSI indicator is overbought : over 80
Type : Neutral
Timeframe : 1 hour
CCI indicator is overbought : over 100
Type : Neutral
Timeframe : 1 hour
Previous candle closed over Bollinger bands
Type : Neutral
Timeframe : 1 hour
Williams %R indicator is overbought : over -20
Type : Neutral
Timeframe : 1 hour
Pivot points : price is over resistance 1
Type : Neutral
Timeframe : Weekly
Pivot points : price is over resistance 3
Type : Neutral
Timeframe : 1 hour
The Central Patterns scanner, which studies chart patterns, resistances and supports, has identified these signals:
Near horizontal resistance
Type : Bearish
Timeframe : 1 hour
Resistance of channel is broken
Type : Bullish
Timeframe : 1 hour
There is also a Japanese candlestick pattern detected by Central Candlesticks that could mark the end of the current short-term trend:
Doji
Type : Neutral
Timeframe : 1 hour
| S3 | S2 | S1 | Price | R1 | R2 | R3 | |
|---|---|---|---|---|---|---|---|
| ProTrendLines | 25.0673 | 25.1151 | 25.1637 | 25.1940 | 25.2065 | 25.3866 | 25.4753 |
| Change (%) | -0.50% | -0.31% | -0.12% | - | +0.05% | +0.76% | +1.12% |
| Change | -0.1267 | -0.0789 | -0.0303 | - | +0.0125 | +0.1926 | +0.2813 |
| Level | Intermediate | Intermediate | Minor | - | Major | Intermediate | Major |
Pivot points can also be used to set your price objectives. Here is the price situation in relation to pivot points:
| Pivot points | S3 | S2 | S1 | PP | R1 | R2 | R3 |
|---|---|---|---|---|---|---|---|
| Standard | 25.0034 | 25.0299 | 25.0515 | 25.0780 | 25.0996 | 25.1261 | 25.1477 |
| Camarilla | 25.0599 | 25.0643 | 25.0687 | 25.0731 | 25.0775 | 25.0819 | 25.0863 |
| Woodie | 25.0010 | 25.0287 | 25.0491 | 25.0768 | 25.0972 | 25.1249 | 25.1453 |
| Fibonacci | 25.0299 | 25.0483 | 25.0596 | 25.0780 | 25.0964 | 25.1077 | 25.1261 |
| Pivot points | S3 | S2 | S1 | PP | R1 | R2 | R3 |
|---|---|---|---|---|---|---|---|
| Standard | 24.8787 | 24.9676 | 25.0203 | 25.1092 | 25.1619 | 25.2508 | 25.3035 |
| Camarilla | 25.0342 | 25.0471 | 25.0601 | 25.0731 | 25.0861 | 25.0991 | 25.1120 |
| Woodie | 24.8607 | 24.9586 | 25.0023 | 25.1002 | 25.1439 | 25.2418 | 25.2855 |
| Fibonacci | 24.9676 | 25.0217 | 25.0551 | 25.1092 | 25.1633 | 25.1967 | 25.2508 |
| Pivot points | S3 | S2 | S1 | PP | R1 | R2 | R3 |
|---|---|---|---|---|---|---|---|
| Standard | 24.7687 | 24.8874 | 25.0473 | 25.1660 | 25.3259 | 25.4446 | 25.6045 |
| Camarilla | 25.1306 | 25.1561 | 25.1817 | 25.2072 | 25.2327 | 25.2583 | 25.2838 |
| Woodie | 24.7893 | 24.8977 | 25.0679 | 25.1763 | 25.3465 | 25.4549 | 25.6251 |
| Fibonacci | 24.8874 | 24.9938 | 25.0596 | 25.1660 | 25.2724 | 25.3382 | 25.4446 |
Numerical data
The following are the details of the technical indicators and moving averages that were collected to generate this technical analysis:
| RSI (14): | 83.84 | |
| MACD (12,26,9): | 0.0187 | |
| Directional Movement: | 38.6886 | |
| AROON (14): | 28.5714 | |
| DEMA (21): | 25.1254 | |
| Parabolic SAR (0,02-0,02-0,2): | 25.0780 | |
| Elder Ray (13): | 0.0694 | |
| Super Trend (3,10): | 25.1342 | |
| Zig ZAG (10): | 25.1896 | |
| VORTEX (21): | 1.3426 | |
| Stochastique (14,3,5): | 98.86 | |
| TEMA (21): | 25.1470 | |
| Williams %R (14): | -1.78 | |
| Chande Momentum Oscillator (20): | 0.1105 | |
| Repulse (5,40,3): | 0.2516 | |
| ROCnROLL: | 1 | |
| TRIX (15,9): | 0.0023 | |
| Courbe Coppock: | 0.48 |
| MA7: | 25.1315 | |
| MA20: | 25.1291 | |
| MA50: | 25.2006 | |
| MA100: | 25.1927 | |
| MAexp7: | 25.1417 | |
| MAexp20: | 25.1074 | |
| MAexp50: | 25.1001 | |
| MAexp100: | 25.1101 | |
| Price / MA7: | +0.25% | |
| Price / MA20: | +0.26% | |
| Price / MA50: | -0.03% | |
| Price / MA100: | +0.01% | |
| Price / MAexp7: | +0.21% | |
| Price / MAexp20: | +0.34% | |
| Price / MAexp50: | +0.37% | |
| Price / MAexp100: | +0.33% |
News
The latest news and videos published on EUR/CZK at the time of the analysis were as follows:
About author

Online


Add a comment
Comments
0 comments on the analysis EUR/CZK - 1H