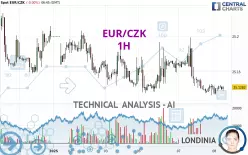
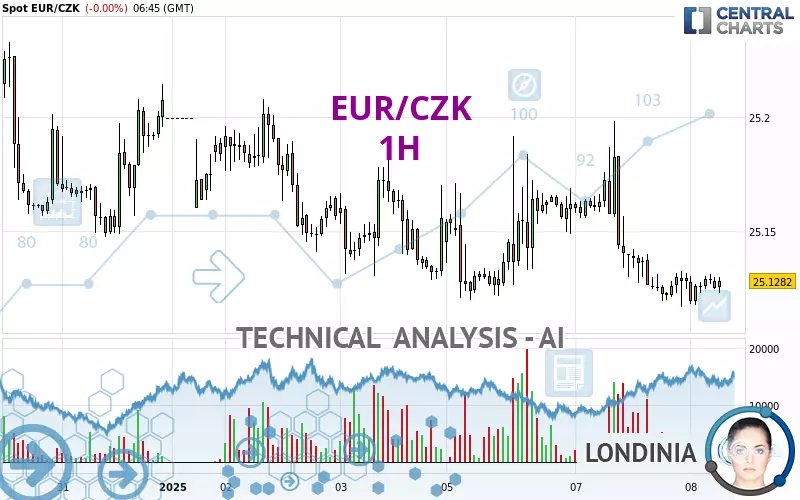
EUR/CZK - 1H - Technical analysis published on 01/08/2025 (GMT)
- 93
- 0
Click here for a new analysis!
- Timeframe : 1H
- - Analysis generated on
- Status : LEVEL MAINTAINED
Summary of the analysis

Additional analysis
Quotes
EUR/CZK rating 25.1282 CZK. On the day, this instrument gained +0.00% and was between 25.1179 CZK and 25.1316 CZK. This implies that the price is at +0.04% from its lowest and at -0.01% from its highest.A bearish opening was detected by the Central Gaps scanner. Sellers are trying to impose a bearish trend in the very short term.
Bearish opening
Type : Bearish
Timeframe : Openning
Here is a more detailed summary of the historical variations registered by EUR/CZK:
Near a new LOW record (1 year)
Type : Bearish
Timeframe : Weekly
Near a new HIGH record (1st january)
Type : Bullish
Timeframe : Weekly
Near a new HIGH record (1 month)
Type : Bullish
Timeframe : Weekly
Technical
Technical analysis of this 1H chart of EUR/CZK indicates that the overall trend is strongly bearish. 92.86% of the signals given by moving averages are bearish. This strongly bearish trend is supported by the strong bearish signals given by short-term moving averages. The Central Indicators scanner detects a bearish signal on moving averages that could impact this trend:
Bearish trend reversal : Moving Average 50
Type : Bearish
Timeframe : 1 hour
The technical indicators are generally neutral. They do not provide relevant information on the direction of future price movements.
The Central Indicators scanner found this result concerning these indicators:
Momentum indicator is back over 0
Type : Bullish
Timeframe : 1 hour
An analysis of the price chart with the Central Patterns scanner (detector of chart patterns and resistances and supports) shows a result that can have an impact on the price change:
Near resistance of channel
Type : Bearish
Timeframe : 1 hour
Central Candlesticks, the scanner specialised in Japanese candlesticks, detects a bullish signal that could support the hypothesis of a small rebound in the very short term:
Bullish harami
Type : Bullish
Timeframe : 1 hour
| S3 | S2 | S1 | Price | R1 | R2 | R3 | |
|---|---|---|---|---|---|---|---|
| ProTrendLines | 24.8366 | 25.0135 | 25.1151 | 25.1282 | 25.1477 | 25.2065 | 25.2400 |
| Change (%) | -1.16% | -0.46% | -0.05% | - | +0.08% | +0.31% | +0.44% |
| Change | -0.2916 | -0.1147 | -0.0131 | - | +0.0195 | +0.0783 | +0.1118 |
| Level | Intermediate | Major | Intermediate | - | Minor | Intermediate | Minor |
To determine price objectives, it is also possible to use the pivot points. Here is the price position in relation to pivot points:
| Pivot points | S3 | S2 | S1 | PP | R1 | R2 | R3 |
|---|---|---|---|---|---|---|---|
| Standard | 25.0167 | 25.0668 | 25.0977 | 25.1478 | 25.1787 | 25.2288 | 25.2597 |
| Camarilla | 25.1062 | 25.1137 | 25.1211 | 25.1285 | 25.1359 | 25.1434 | 25.1508 |
| Woodie | 25.0070 | 25.0620 | 25.0880 | 25.1430 | 25.1690 | 25.2240 | 25.2500 |
| Fibonacci | 25.0668 | 25.0978 | 25.1169 | 25.1478 | 25.1788 | 25.1979 | 25.2288 |
| Pivot points | S3 | S2 | S1 | PP | R1 | R2 | R3 |
|---|---|---|---|---|---|---|---|
| Standard | 24.9693 | 25.0402 | 25.0981 | 25.1690 | 25.2269 | 25.2978 | 25.3557 |
| Camarilla | 25.1205 | 25.1323 | 25.1441 | 25.1559 | 25.1677 | 25.1795 | 25.1913 |
| Woodie | 24.9627 | 25.0370 | 25.0915 | 25.1658 | 25.2203 | 25.2946 | 25.3491 |
| Fibonacci | 25.0402 | 25.0894 | 25.1198 | 25.1690 | 25.2182 | 25.2486 | 25.2978 |
| Pivot points | S3 | S2 | S1 | PP | R1 | R2 | R3 |
|---|---|---|---|---|---|---|---|
| Standard | 24.7687 | 24.8874 | 25.0473 | 25.1660 | 25.3259 | 25.4446 | 25.6045 |
| Camarilla | 25.1306 | 25.1561 | 25.1817 | 25.2072 | 25.2327 | 25.2583 | 25.2838 |
| Woodie | 24.7893 | 24.8977 | 25.0679 | 25.1763 | 25.3465 | 25.4549 | 25.6251 |
| Fibonacci | 24.8874 | 24.9938 | 25.0596 | 25.1660 | 25.2724 | 25.3382 | 25.4446 |
Numerical data
The following is the status of the technical indicators and moving averages at the time of publication of this technical analysis:
| RSI (14): | 43.45 | |
| MACD (12,26,9): | -0.0057 | |
| Directional Movement: | -2.6922 | |
| AROON (14): | -50.0000 | |
| DEMA (21): | 25.1241 | |
| Parabolic SAR (0,02-0,02-0,2): | 25.1178 | |
| Elder Ray (13): | -0.0014 | |
| Super Trend (3,10): | 25.1550 | |
| Zig ZAG (10): | 25.1279 | |
| VORTEX (21): | 0.8577 | |
| Stochastique (14,3,5): | 60.92 | |
| TEMA (21): | 25.1222 | |
| Williams %R (14): | -31.64 | |
| Chande Momentum Oscillator (20): | 0.0027 | |
| Repulse (5,40,3): | 0.0126 | |
| ROCnROLL: | 2 | |
| TRIX (15,9): | -0.0040 | |
| Courbe Coppock: | 0.06 |
| MA7: | 25.1583 | |
| MA20: | 25.1235 | |
| MA50: | 25.2146 | |
| MA100: | 25.1922 | |
| MAexp7: | 25.1273 | |
| MAexp20: | 25.1321 | |
| MAexp50: | 25.1407 | |
| MAexp100: | 25.1480 | |
| Price / MA7: | -0.12% | |
| Price / MA20: | +0.02% | |
| Price / MA50: | -0.34% | |
| Price / MA100: | -0.25% | |
| Price / MAexp7: | +0.00% | |
| Price / MAexp20: | -0.02% | |
| Price / MAexp50: | -0.05% | |
| Price / MAexp100: | -0.08% |
News
Don't forget to follow the news on EUR/CZK. At the time of publication of this analysis, the latest news was as follows:
About author
Online


Add a comment
Comments
0 comments on the analysis EUR/CZK - 1H