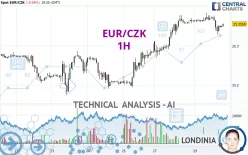
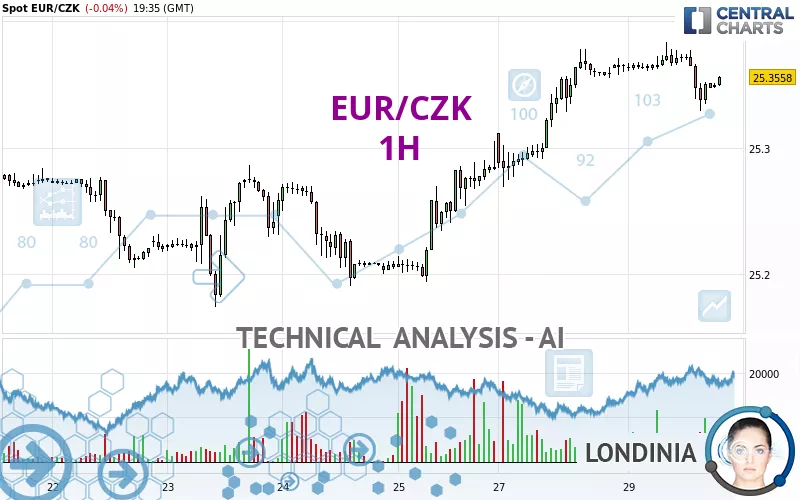
EUR/CZK - 1H - Technical analysis published on 10/29/2024 (GMT)
- 136
- 0
Click here for a new analysis!
- Timeframe : 1H
- - Analysis generated on
- Status : LEVEL MAINTAINED
Summary of the analysis

Additional analysis
Quotes
The EUR/CZK price is 25.3558 CZK. On the day, this instrument lost -0.04% and was between 25.3287 CZK and 25.3833 CZK. This implies that the price is at +0.11% from its lowest and at -0.11% from its highest.The Central Gaps scanner detects a bearish opening marking the presence of sellers ahead of buyers at the opening but not sufficiently marked to allow the price to register a quotation gap.
Bearish opening
Type : Bearish
Timeframe : Openning
So that you have an overall view of the price change, here is a table showing the variations over several periods:
Near a new LOW record (1 year)
Type : Bearish
Timeframe : Weekly
Near a new LOW record (1st january)
Type : Bearish
Timeframe : Weekly
New HIGH record (1 month)
Type : Bullish
Timeframe : Weekly
Technical
A technical analysis in 1H of this EUR/CZK chart shows a bullish trend. 78.57% of the signals given by moving averages are bullish. Caution: the neutral signals currently given by short-term moving averages show us that the global trend is losing momentum. There is no crossing of moving average by the price or crossing of moving averages between themselves.
An assessment of technical indicators does not currently provide any relevant information on the direction of future price movements.
Other results related to technical indicators were also found by the Central Indicators scanner:
Pivot points : price is over resistance 1
Type : Neutral
Timeframe : Weekly
RSI indicator is back over 50
Type : Bullish
Timeframe : 1 hour
The Central Patterns scanner, which studies chart patterns, resistances and supports, has identified this signal:
Near support of channel
Type : Bullish
Timeframe : 1 hour
The Central Candlesticks scanner, specialised in Japanese candlesticks, did not identify any signals.
| S3 | S2 | S1 | Price | R1 | R2 | R3 | |
|---|---|---|---|---|---|---|---|
| ProTrendLines | 25.1202 | 25.2104 | 25.2852 | 25.3558 | 25.3716 | 25.4719 | 25.7724 |
| Change (%) | -0.93% | -0.57% | -0.28% | - | +0.06% | +0.46% | +1.64% |
| Change | -0.2356 | -0.1454 | -0.0706 | - | +0.0158 | +0.1161 | +0.4166 |
| Level | Minor | Major | Intermediate | - | Major | Major | Intermediate |
Pivot points can also be used to set your price objectives. Here is the price situation in relation to pivot points:
| Pivot points | S3 | S2 | S1 | PP | R1 | R2 | R3 |
|---|---|---|---|---|---|---|---|
| Standard | 25.1876 | 25.2282 | 25.2966 | 25.3372 | 25.4056 | 25.4462 | 25.5146 |
| Camarilla | 25.3350 | 25.3450 | 25.3550 | 25.3650 | 25.3750 | 25.3850 | 25.3950 |
| Woodie | 25.2015 | 25.2352 | 25.3105 | 25.3442 | 25.4195 | 25.4532 | 25.5285 |
| Fibonacci | 25.2282 | 25.2698 | 25.2956 | 25.3372 | 25.3788 | 25.4046 | 25.4462 |
| Pivot points | S3 | S2 | S1 | PP | R1 | R2 | R3 |
|---|---|---|---|---|---|---|---|
| Standard | 25.0723 | 25.1232 | 25.2032 | 25.2541 | 25.3341 | 25.3850 | 25.4650 |
| Camarilla | 25.2472 | 25.2592 | 25.2712 | 25.2832 | 25.2952 | 25.3072 | 25.3192 |
| Woodie | 25.0869 | 25.1305 | 25.2178 | 25.2614 | 25.3487 | 25.3923 | 25.4796 |
| Fibonacci | 25.1232 | 25.1732 | 25.2041 | 25.2541 | 25.3041 | 25.3350 | 25.3850 |
| Pivot points | S3 | S2 | S1 | PP | R1 | R2 | R3 |
|---|---|---|---|---|---|---|---|
| Standard | 24.8238 | 24.9085 | 25.0641 | 25.1488 | 25.3044 | 25.3891 | 25.5447 |
| Camarilla | 25.1537 | 25.1758 | 25.1978 | 25.2198 | 25.2418 | 25.2639 | 25.2859 |
| Woodie | 24.8594 | 24.9262 | 25.0997 | 25.1665 | 25.3400 | 25.4068 | 25.5803 |
| Fibonacci | 24.9085 | 25.0003 | 25.0570 | 25.1488 | 25.2406 | 25.2973 | 25.3891 |
Numerical data
The following is the status of technical indicators and moving averages registered at the time this technical analysis was created:
| RSI (14): | 47.35 | |
| MACD (12,26,9): | 0.0016 | |
| Directional Movement: | -9.5626 | |
| AROON (14): | -50.0000 | |
| DEMA (21): | 25.3604 | |
| Parabolic SAR (0,02-0,02-0,2): | 25.3743 | |
| Elder Ray (13): | -0.0049 | |
| Super Trend (3,10): | 25.3776 | |
| Zig ZAG (10): | 25.3497 | |
| VORTEX (21): | 0.9572 | |
| Stochastique (14,3,5): | 37.18 | |
| TEMA (21): | 25.3492 | |
| Williams %R (14): | -58.97 | |
| Chande Momentum Oscillator (20): | -0.0178 | |
| Repulse (5,40,3): | 0.0049 | |
| ROCnROLL: | -1 | |
| TRIX (15,9): | 0.0034 | |
| Courbe Coppock: | 0.11 |
| MA7: | 25.2799 | |
| MA20: | 25.2947 | |
| MA50: | 25.1739 | |
| MA100: | 25.1684 | |
| MAexp7: | 25.3520 | |
| MAexp20: | 25.3552 | |
| MAexp50: | 25.3361 | |
| MAexp100: | 25.3077 | |
| Price / MA7: | +0.30% | |
| Price / MA20: | +0.24% | |
| Price / MA50: | +0.72% | |
| Price / MA100: | +0.74% | |
| Price / MAexp7: | +0.01% | |
| Price / MAexp20: | +0.00% | |
| Price / MAexp50: | +0.08% | |
| Price / MAexp100: | +0.19% |
News
Don't forget to follow the news on EUR/CZK. At the time of publication of this analysis, the latest news was as follows:
About author
Online


Add a comment
Comments
0 comments on the analysis EUR/CZK - 1H