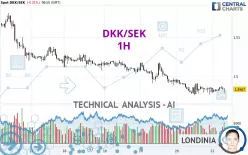
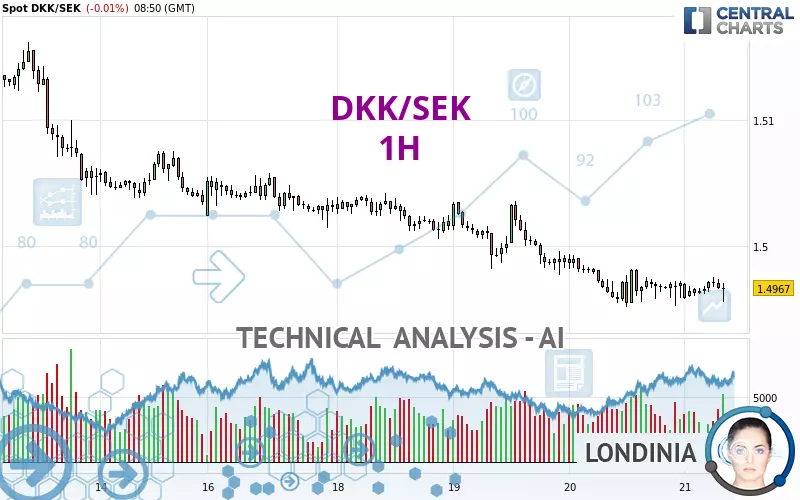
DKK/SEK - 1H - Technical analysis published on 02/21/2025 (GMT)
- 86
- 0
Click here for a new analysis!
- Timeframe : 1H
- - Analysis generated on
- Status : TARGET REACHED
Summary of the analysis

Additional analysis
Quotes
The DKK/SEK rating is 1.4967 SEK. The price is lower by -0.01% since the last closing with the lowest point at 1.4956 SEK and the highest point at 1.4976 SEK. The deviation from the price is +0.07% for the low point and -0.06% for the high point.A bullish opening was detected by the Central Gaps scanner. Buyers are trying to impose a bullish momentum in the very short term.
Bullish opening
Type : Bullish
Timeframe : Openning
Here is a more detailed summary of the historical variations registered by DKK/SEK:
Near a new LOW record (1 year)
Type : Bearish
Timeframe : Weekly
Near a new HIGH record (1st january)
Type : Bullish
Timeframe : Weekly
Near a new HIGH record (1 month)
Type : Bullish
Timeframe : Weekly
Technical
Technical analysis of DKK/SEK in 1H shows a overall strongly bearish trend. The signals given by moving averages are 89.29% bearish. This strongly bearish trend seems to be slowing down given the slightly bearish signals being given by short-term moving averages. The Central Indicators scanner detects a bearish signal on moving averages that could impact this trend:
Bearish trend reversal : adaptative moving average 20
Type : Bearish
Timeframe : 1 hour
In fact, of the 18 technical indicators analysed by Central Analyzer, 7 are bullish, 6 are neutral and 5 are bearish. Central Indicators, the detector scanner for these technical indicators recently detected a signal:
Pivot points : price is under support 1
Type : Neutral
Timeframe : Weekly
An analysis of the price chart with the Central Patterns scanner (detector of chart patterns and resistances and supports) shows a result that can have an impact on the price change:
Resistance of channel is broken
Type : Bullish
Timeframe : 1 hour
The Central Candlesticks scanner, specialised in Japanese candlesticks, did not identify any signals.
| S3 | S2 | S1 | Price | R1 | R2 | R3 | |
|---|---|---|---|---|---|---|---|
| ProTrendLines | 1.3284 | 1.3769 | 1.4952 | 1.4967 | 1.4972 | 1.5036 | 1.5104 |
| Change (%) | -11.24% | -8.00% | -0.10% | - | +0.03% | +0.46% | +0.92% |
| Change | -0.1683 | -0.1198 | -0.0015 | - | +0.0005 | +0.0069 | +0.0137 |
| Level | Major | Minor | Intermediate | - | Major | Major | Minor |
Pivot points can also be used to set your price objectives. Here is the price situation in relation to pivot points:
| Pivot points | S3 | S2 | S1 | PP | R1 | R2 | R3 |
|---|---|---|---|---|---|---|---|
| Standard | 1.4907 | 1.4930 | 1.4949 | 1.4972 | 1.4991 | 1.5014 | 1.5033 |
| Camarilla | 1.4958 | 1.4961 | 1.4965 | 1.4969 | 1.4973 | 1.4977 | 1.4981 |
| Woodie | 1.4906 | 1.4929 | 1.4948 | 1.4971 | 1.4990 | 1.5013 | 1.5032 |
| Fibonacci | 1.4930 | 1.4946 | 1.4956 | 1.4972 | 1.4988 | 1.4998 | 1.5014 |
| Pivot points | S3 | S2 | S1 | PP | R1 | R2 | R3 |
|---|---|---|---|---|---|---|---|
| Standard | 1.4832 | 1.4932 | 1.4984 | 1.5084 | 1.5136 | 1.5236 | 1.5288 |
| Camarilla | 1.4993 | 1.5007 | 1.5021 | 1.5035 | 1.5049 | 1.5063 | 1.5077 |
| Woodie | 1.4807 | 1.4920 | 1.4959 | 1.5072 | 1.5111 | 1.5224 | 1.5263 |
| Fibonacci | 1.4932 | 1.4990 | 1.5026 | 1.5084 | 1.5142 | 1.5178 | 1.5236 |
| Pivot points | S3 | S2 | S1 | PP | R1 | R2 | R3 |
|---|---|---|---|---|---|---|---|
| Standard | 1.5164 | 1.5233 | 1.5323 | 1.5392 | 1.5482 | 1.5551 | 1.5641 |
| Camarilla | 1.5368 | 1.5383 | 1.5397 | 1.5412 | 1.5427 | 1.5441 | 1.5456 |
| Woodie | 1.5174 | 1.5238 | 1.5333 | 1.5397 | 1.5492 | 1.5556 | 1.5651 |
| Fibonacci | 1.5233 | 1.5294 | 1.5332 | 1.5392 | 1.5453 | 1.5491 | 1.5551 |
Numerical data
The following is the status of the technical indicators and moving averages at the time of publication of this technical analysis:
| RSI (14): | 43.68 | |
| MACD (12,26,9): | -0.0004 | |
| Directional Movement: | -11.5162 | |
| AROON (14): | 57.1429 | |
| DEMA (21): | 1.4963 | |
| Parabolic SAR (0,02-0,02-0,2): | 1.4977 | |
| Elder Ray (13): | -0.0004 | |
| Super Trend (3,10): | 1.4991 | |
| Zig ZAG (10): | 1.4965 | |
| VORTEX (21): | 0.9921 | |
| Stochastique (14,3,5): | 63.77 | |
| TEMA (21): | 1.4967 | |
| Williams %R (14): | -43.48 | |
| Chande Momentum Oscillator (20): | -0.0001 | |
| Repulse (5,40,3): | -0.0008 | |
| ROCnROLL: | 2 | |
| TRIX (15,9): | -0.0046 | |
| Courbe Coppock: | 0.03 |
| MA7: | 1.5009 | |
| MA20: | 1.5172 | |
| MA50: | 1.5307 | |
| MA100: | 1.5366 | |
| MAexp7: | 1.4967 | |
| MAexp20: | 1.4969 | |
| MAexp50: | 1.4981 | |
| MAexp100: | 1.5003 | |
| Price / MA7: | -0.28% | |
| Price / MA20: | -1.35% | |
| Price / MA50: | -2.22% | |
| Price / MA100: | -2.60% | |
| Price / MAexp7: | -0% | |
| Price / MAexp20: | -0.01% | |
| Price / MAexp50: | -0.09% | |
| Price / MAexp100: | -0.24% |
About author
Online


Add a comment
Comments
0 comments on the analysis DKK/SEK - 1H