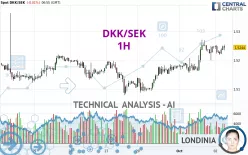
DKK/SEK - 1H - Technical analysis published on 10/02/2024 (GMT)
- 102
- 0
Click here for a new analysis!
- Timeframe : 1H
- - Analysis generated on
- Status : INVALID

Summary of the analysis

Additional analysis
Quotes
The DKK/SEK price is 1.5244 SEK. On the day, this instrument lost -0.01% with the lowest point at 1.5218 SEK and the highest point at 1.5254 SEK. The deviation from the price is +0.17% for the low point and -0.07% for the high point.The Central Gaps scanner detects a bullish opening. A small advantage for buyers in the very short term.
Bullish opening
Type : Bullish
Timeframe : Openning
Here is a more detailed summary of the historical variations registered by DKK/SEK:
Near a new HIGH record (1 year)
Type : Bullish
Timeframe : Weekly
Near a new HIGH record (1st january)
Type : Bullish
Timeframe : Weekly
Near a new HIGH record (1 month)
Type : Bullish
Timeframe : Weekly
Technical
Technical analysis of this 1H chart of DKK/SEK indicates that the overall trend is strongly bullish. 92.86% of the signals given by moving averages are bullish. This strongly bullish trend is supported by the strong bullish signals given by short-term moving averages. The Central Indicators scanner does not detect any result on moving averages that would impact this trend.
The technical indicators are generally neutral. They do not provide relevant information on the direction of future price movements.
Other results related to technical indicators were also found by the Central Indicators scanner:
Price is back over the pivot point
Type : Bullish
Timeframe : Weekly
Momentum indicator is back over 0
Type : Bullish
Timeframe : 1 hour
An analysis of the price chart with the Central Patterns scanner (detector of chart patterns and resistances and supports) shows a result that can have an impact on the price change:
Near resistance of triangle
Type : Bearish
Timeframe : 1 hour
The Central Candlesticks scanner, specialised in Japanese candlesticks, did not identify any signals.
| S3 | S2 | S1 | Price | R1 | R2 | R3 | |
|---|---|---|---|---|---|---|---|
| ProTrendLines | 1.5121 | 1.5172 | 1.5197 | 1.5244 | 1.5271 | 1.5311 | 1.5364 |
| Change (%) | -0.81% | -0.47% | -0.31% | - | +0.18% | +0.44% | +0.79% |
| Change | -0.0123 | -0.0072 | -0.0047 | - | +0.0027 | +0.0067 | +0.0120 |
| Level | Minor | Major | Intermediate | - | Minor | Intermediate | Intermediate |
To determine price objectives, it is also possible to use the pivot points. Here is the price position in relation to pivot points:
| Pivot points | S3 | S2 | S1 | PP | R1 | R2 | R3 |
|---|---|---|---|---|---|---|---|
| Standard | 1.5064 | 1.5111 | 1.5178 | 1.5225 | 1.5292 | 1.5339 | 1.5406 |
| Camarilla | 1.5215 | 1.5225 | 1.5236 | 1.5246 | 1.5257 | 1.5267 | 1.5277 |
| Woodie | 1.5075 | 1.5116 | 1.5189 | 1.5230 | 1.5303 | 1.5344 | 1.5417 |
| Fibonacci | 1.5111 | 1.5154 | 1.5181 | 1.5225 | 1.5268 | 1.5295 | 1.5339 |
| Pivot points | S3 | S2 | S1 | PP | R1 | R2 | R3 |
|---|---|---|---|---|---|---|---|
| Standard | 1.4714 | 1.4896 | 1.5000 | 1.5182 | 1.5286 | 1.5468 | 1.5572 |
| Camarilla | 1.5025 | 1.5052 | 1.5078 | 1.5104 | 1.5130 | 1.5156 | 1.5183 |
| Woodie | 1.4675 | 1.4877 | 1.4961 | 1.5163 | 1.5247 | 1.5449 | 1.5533 |
| Fibonacci | 1.4896 | 1.5005 | 1.5073 | 1.5182 | 1.5291 | 1.5359 | 1.5468 |
| Pivot points | S3 | S2 | S1 | PP | R1 | R2 | R3 |
|---|---|---|---|---|---|---|---|
| Standard | 1.4745 | 1.4911 | 1.5046 | 1.5212 | 1.5347 | 1.5513 | 1.5648 |
| Camarilla | 1.5097 | 1.5125 | 1.5152 | 1.5180 | 1.5208 | 1.5235 | 1.5263 |
| Woodie | 1.4729 | 1.4903 | 1.5030 | 1.5204 | 1.5331 | 1.5505 | 1.5632 |
| Fibonacci | 1.4911 | 1.5026 | 1.5097 | 1.5212 | 1.5327 | 1.5398 | 1.5513 |
Numerical data
The following is the status of technical indicators and moving averages registered at the time this technical analysis was created:
| RSI (14): | 58.33 | |
| MACD (12,26,9): | 0.0014 | |
| Directional Movement: | 6.3039 | |
| AROON (14): | -28.5714 | |
| DEMA (21): | 1.5247 | |
| Parabolic SAR (0,02-0,02-0,2): | 1.5259 | |
| Elder Ray (13): | 0.0013 | |
| Super Trend (3,10): | 1.5188 | |
| Zig ZAG (10): | 1.5239 | |
| VORTEX (21): | 1.1616 | |
| Stochastique (14,3,5): | 59.02 | |
| TEMA (21): | 1.5246 | |
| Williams %R (14): | -44.29 | |
| Chande Momentum Oscillator (20): | 0.0001 | |
| Repulse (5,40,3): | -0.0369 | |
| ROCnROLL: | 1 | |
| TRIX (15,9): | 0.0162 | |
| Courbe Coppock: | 0.18 |
| MA7: | 1.5182 | |
| MA20: | 1.5223 | |
| MA50: | 1.5322 | |
| MA100: | 1.5318 | |
| MAexp7: | 1.5238 | |
| MAexp20: | 1.5226 | |
| MAexp50: | 1.5200 | |
| MAexp100: | 1.5184 | |
| Price / MA7: | +0.41% | |
| Price / MA20: | +0.14% | |
| Price / MA50: | -0.51% | |
| Price / MA100: | -0.48% | |
| Price / MAexp7: | +0.04% | |
| Price / MAexp20: | +0.12% | |
| Price / MAexp50: | +0.29% | |
| Price / MAexp100: | +0.40% |
About author
Online


Add a comment
Comments
0 comments on the analysis DKK/SEK - 1H