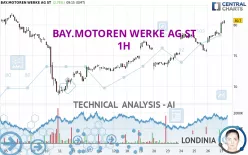
BAY.MOTOREN WERKE AG ST - 1H - Technical analysis published on 09/27/2024 (GMT)
- 121
- 0
Click here for a new analysis!
- Timeframe : 1H
- - Analysis generated on
- Status : INVALID

Summary of the analysis

Additional analysis
Quotes
The BAY.MOTOREN WERKE AG ST price is 80.70 EUR. The price registered an increase of +2.75% on the session and was between 78.66 EUR and 80.70 EUR. This implies that the price is at +2.59% from its lowest and at 0% from its highest.A bullish opening was detected by the Central Gaps scanner. Buyers are trying to impose a bullish momentum in the very short term.
Bullish opening
Type : Bullish
Timeframe : Openning
So that you have an overall view of the price change, here is a table showing the variations over several periods:
Technical
Technical analysis of BAY.MOTOREN WERKE AG ST in 1H shows a strongly overall bullish trend. The signals given by the moving averages are 92.86% bullish. This strong bullish trend is confirmed by the strong signals currently being given by short-term moving averages. The Central Indicators scanner does not detect any result on moving averages that would impact this trend.
In fact, 17 technical indicators on 18 studied are currently positioned bullish. Caution: the Central Indicators scanner currently detects an excess:
RSI indicator is overbought : over 70
Type : Neutral
Timeframe : 1 hour
CCI indicator is overbought : over 100
Type : Neutral
Timeframe : 1 hour
Williams %R indicator is overbought : over -20
Type : Neutral
Timeframe : 1 hour
Pivot points : price is over resistance 2
Type : Neutral
Timeframe : 1 hour
Pivot points : price is over resistance 2
Type : Neutral
Timeframe : Weekly
Central Patterns, the scanner specializing in chart patterns, did not identify any signals.
The Central Candlesticks scanner which studies Japanese candlesticks did not detect anything.
| S3 | S2 | S1 | Price | R1 | R2 | R3 | |
|---|---|---|---|---|---|---|---|
| ProTrendLines | 77.36 | 78.71 | 80.03 | 80.70 | 82.52 | 84.28 | 86.97 |
| Change (%) | -4.14% | -2.47% | -0.83% | - | +2.26% | +4.44% | +7.77% |
| Change | -3.34 | -1.99 | -0.67 | - | +1.82 | +3.58 | +6.27 |
| Level | Major | Major | Minor | - | Major | Minor | Major |
To determine price objectives, it is also possible to use the pivot points. Here is the price position in relation to pivot points:
| Pivot points | S3 | S2 | S1 | PP | R1 | R2 | R3 |
|---|---|---|---|---|---|---|---|
| Standard | 75.29 | 76.15 | 77.35 | 78.21 | 79.41 | 80.27 | 81.47 |
| Camarilla | 77.97 | 78.16 | 78.35 | 78.54 | 78.73 | 78.92 | 79.11 |
| Woodie | 75.45 | 76.24 | 77.51 | 78.30 | 79.57 | 80.36 | 81.63 |
| Fibonacci | 76.15 | 76.94 | 77.43 | 78.21 | 79.00 | 79.49 | 80.27 |
| Pivot points | S3 | S2 | S1 | PP | R1 | R2 | R3 |
|---|---|---|---|---|---|---|---|
| Standard | 66.58 | 69.52 | 71.58 | 74.52 | 76.58 | 79.52 | 81.58 |
| Camarilla | 72.27 | 72.72 | 73.18 | 73.64 | 74.10 | 74.56 | 75.02 |
| Woodie | 66.14 | 69.30 | 71.14 | 74.30 | 76.14 | 79.30 | 81.14 |
| Fibonacci | 69.52 | 71.43 | 72.61 | 74.52 | 76.43 | 77.61 | 79.52 |
| Pivot points | S3 | S2 | S1 | PP | R1 | R2 | R3 |
|---|---|---|---|---|---|---|---|
| Standard | 71.10 | 74.54 | 79.18 | 82.62 | 87.26 | 90.70 | 95.34 |
| Camarilla | 81.60 | 82.34 | 83.08 | 83.82 | 84.56 | 85.30 | 86.04 |
| Woodie | 71.70 | 74.84 | 79.78 | 82.92 | 87.86 | 91.00 | 95.94 |
| Fibonacci | 74.54 | 77.63 | 79.53 | 82.62 | 85.71 | 87.61 | 90.70 |
Numerical data
The following is the status of technical indicators and moving averages registered at the time this technical analysis was created:
| RSI (14): | 73.62 | |
| MACD (12,26,9): | 0.8500 | |
| Directional Movement: | 30.95 | |
| AROON (14): | 78.57 | |
| DEMA (21): | 79.23 | |
| Parabolic SAR (0,02-0,02-0,2): | 77.71 | |
| Elder Ray (13): | 1.71 | |
| Super Trend (3,10): | 78.34 | |
| Zig ZAG (10): | 80.44 | |
| VORTEX (21): | 1.0500 | |
| Stochastique (14,3,5): | 93.66 | |
| TEMA (21): | 79.53 | |
| Williams %R (14): | -4.05 | |
| Chande Momentum Oscillator (20): | 4.54 | |
| Repulse (5,40,3): | 1.9600 | |
| ROCnROLL: | 1 | |
| TRIX (15,9): | 0.1100 | |
| Courbe Coppock: | 6.04 |
| MA7: | 76.83 | |
| MA20: | 76.21 | |
| MA50: | 80.65 | |
| MA100: | 85.80 | |
| MAexp7: | 79.21 | |
| MAexp20: | 78.20 | |
| MAexp50: | 76.95 | |
| MAexp100: | 76.41 | |
| Price / MA7: | +5.04% | |
| Price / MA20: | +5.89% | |
| Price / MA50: | +0.06% | |
| Price / MA100: | -5.94% | |
| Price / MAexp7: | +1.88% | |
| Price / MAexp20: | +3.20% | |
| Price / MAexp50: | +4.87% | |
| Price / MAexp100: | +5.61% |
News
Don't forget to follow the news on BAY.MOTOREN WERKE AG ST. At the time of publication of this analysis, the latest news was as follows:
- BMW, Ford and Honda Begin Operations of Vehicle-Grid Integration Joint Venture ChargeScape; Name Joseph Vellone CEO
- Keegan Bradley Claims Victory at BMW Championship
- Infinix Launches All-New NOTE 40 Series Racing Edition In Partnership with BMW Group Designworks in Saudi Arabia
- BMW of North America, LLC and World Woman Foundation Return for 2024 'World Woman Hour’ at the Grammy Museum in Los Angeles
- Innoviz to Showcase All-New BMW i7 and Volkswagen ID. Buzz at CES Booth; LiDAR Capabilities Will Be Demonstrated
About author

Online


Add a comment
Comments
0 comments on the analysis BAY.MOTOREN WERKE AG ST - 1H