BAYER AG NA O.N. - 1H - Technical analysis published on 09/27/2024 (GMT)
- 119
- 0
Click here for a new analysis!
- Timeframe : 1H
- - Analysis generated on
- Status : TARGET REACHED

Summary of the analysis

Additional analysis
Quotes
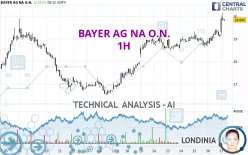
The BAYER AG NA O.N. rating is 29.845 EUR. The price has increased by +2.51% since the last closing with the lowest point at 29.200 EUR and the highest point at 30.140 EUR. The deviation from the price is +2.21% for the low point and -0.98% for the high point.A bullish opening was detected by the Central Gaps scanner. Buyers are trying to impose a bullish momentum in the very short term.
Bullish opening
Type : Bullish
Timeframe : Openning
Here is a more detailed summary of the historical variations registered by BAYER AG NA O.N.:
New HIGH record (1 month)
Type : Bullish
Timeframe : Weekly
Technical
Technical analysis of BAYER AG NA O.N. in 1H shows a strongly overall bullish trend. 92.86% of the signals given by moving averages are bullish. The overall trend is supported by the strong bullish signals from short-term moving averages. The Central Indicators market scanner currently does not detect any result that concerns moving averages.
An assessment of technical indicators shows a strong bullish signal.
Caution: the Central Indicators scanner currently detects an excess:
CCI indicator is overbought : over 100
Type : Neutral
Timeframe : 1 hour
Previous candle closed over Bollinger bands
Type : Neutral
Timeframe : 1 hour
Williams %R indicator is overbought : over -20
Type : Neutral
Timeframe : 1 hour
Pivot points : price is over resistance 1
Type : Neutral
Timeframe : Weekly
Pivot points : price is over resistance 2
Type : Neutral
Timeframe : 1 hour
An analysis of the price chart with the Central Patterns scanner (detector of chart patterns and resistances and supports) shows several results that can have an impact on the price change:
Near horizontal resistance
Type : Bearish
Timeframe : 1 hour
Resistance of channel is broken
Type : Bullish
Timeframe : 1 hour
The presence of a bullish Japanese candlestick pattern detected by Central Candlesticks that could cause a very short term rebound was also detected:
Bullish harami
Type : Bullish
Timeframe : 1 hour
| S3 | S2 | S1 | Price | R1 | R2 | R3 | |
|---|---|---|---|---|---|---|---|
| ProTrendLines | 27.600 | 28.613 | 29.321 | 29.845 | 29.890 | 32.260 | 36.207 |
| Change (%) | -7.52% | -4.13% | -1.76% | - | +0.15% | +8.09% | +21.32% |
| Change | -2.245 | -1.232 | -0.524 | - | +0.045 | +2.415 | +6.362 |
| Level | Intermediate | Intermediate | Major | - | Minor | Minor | Intermediate |
Pivot points can also be used to set your price objectives. Here is the price situation in relation to pivot points:
| Pivot points | S3 | S2 | S1 | PP | R1 | R2 | R3 |
|---|---|---|---|---|---|---|---|
| Standard | 27.962 | 28.318 | 28.717 | 29.073 | 29.472 | 29.828 | 30.227 |
| Camarilla | 28.907 | 28.977 | 29.046 | 29.115 | 29.184 | 29.253 | 29.323 |
| Woodie | 27.983 | 28.329 | 28.738 | 29.084 | 29.493 | 29.839 | 30.248 |
| Fibonacci | 28.318 | 28.607 | 28.785 | 29.073 | 29.362 | 29.540 | 29.828 |
| Pivot points | S3 | S2 | S1 | PP | R1 | R2 | R3 |
|---|---|---|---|---|---|---|---|
| Standard | 24.515 | 25.510 | 27.085 | 28.080 | 29.655 | 30.650 | 32.225 |
| Camarilla | 27.953 | 28.189 | 28.424 | 28.660 | 28.896 | 29.131 | 29.367 |
| Woodie | 24.805 | 25.655 | 27.375 | 28.225 | 29.945 | 30.795 | 32.515 |
| Fibonacci | 25.510 | 26.492 | 27.098 | 28.080 | 29.062 | 29.668 | 30.650 |
| Pivot points | S3 | S2 | S1 | PP | R1 | R2 | R3 |
|---|---|---|---|---|---|---|---|
| Standard | 21.122 | 23.218 | 25.542 | 27.638 | 29.962 | 32.058 | 34.382 |
| Camarilla | 26.650 | 27.055 | 27.460 | 27.865 | 28.270 | 28.675 | 29.081 |
| Woodie | 21.235 | 23.275 | 25.655 | 27.695 | 30.075 | 32.115 | 34.495 |
| Fibonacci | 23.218 | 24.907 | 25.950 | 27.638 | 29.327 | 30.370 | 32.058 |
Numerical data
The following are the details of the technical indicators and moving averages that were collected to generate this technical analysis:
| RSI (14): | 71.72 | |
| MACD (12,26,9): | 0.2110 | |
| Directional Movement: | 33.736 | |
| AROON (14): | 85.714 | |
| DEMA (21): | 29.435 | |
| Parabolic SAR (0,02-0,02-0,2): | 28.918 | |
| Elder Ray (13): | 0.711 | |
| Super Trend (3,10): | 29.214 | |
| Zig ZAG (10): | 29.955 | |
| VORTEX (21): | 1.1610 | |
| Stochastique (14,3,5): | 79.89 | |
| TEMA (21): | 29.510 | |
| Williams %R (14): | -15.13 | |
| Chande Momentum Oscillator (20): | 1.085 | |
| Repulse (5,40,3): | 1.1140 | |
| ROCnROLL: | 1 | |
| TRIX (15,9): | 0.0570 | |
| Courbe Coppock: | 3.47 |
| MA7: | 28.988 | |
| MA20: | 28.188 | |
| MA50: | 27.606 | |
| MA100: | 27.394 | |
| MAexp7: | 29.468 | |
| MAexp20: | 29.189 | |
| MAexp50: | 28.858 | |
| MAexp100: | 28.505 | |
| Price / MA7: | +2.96% | |
| Price / MA20: | +5.88% | |
| Price / MA50: | +8.11% | |
| Price / MA100: | +8.95% | |
| Price / MAexp7: | +1.28% | |
| Price / MAexp20: | +2.25% | |
| Price / MAexp50: | +3.42% | |
| Price / MAexp100: | +4.70% |
News
Don't forget to follow the news on BAYER AG NA O.N.. At the time of publication of this analysis, the latest news was as follows:
- Freight Technologies Secures Win with Bayer
- Webinar: Translate Emissions Data Into Decarbonization Strategies With BMS, Bayer, and Lythouse
- Bayer Implements OMP Demand Planning Worldwide
- West Virginia Resident Sues Union Carbide, Dow Chemical, Bayer Crop Science and Other Companies for Exposure to Cancer-Causing Ethylene Oxide
-
 WATCH: Bayer Leverkusen clinch German Bundesliga title
About author

Online


Add a comment
Comments
0 comments on the analysis BAYER AG NA O.N. - 1H