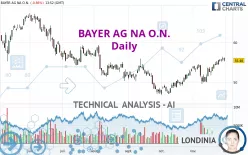
BAYER AG NA O.N. - Daily - Technical analysis published on 11/30/2022 (GMT)
- 218
- 0
Click here for a new analysis!
- Timeframe : Daily
- - Analysis generated on
- Status : INVALID

Summary of the analysis

Additional analysis
Quotes
The BAYER AG NA O.N. rating is 55.48 EUR. On the day, this instrument lost -0.86% and was between 55.25 EUR and 56.25 EUR. This implies that the price is at +0.42% from its lowest and at -1.37% from its highest.The Central Gaps scanner detects a bullish opening. A small advantage for buyers in the very short term.
Bullish opening
Type : Bullish
Timeframe : Openning
So that you have an overall view of the price change, here is a table showing the variations over several periods:
Near a new HIGH record (1 month)
Type : Bullish
Timeframe : Weekly
Technical
Technical analysis of BAYER AG NA O.N. in Daily shows an overall bullish trend. The signals returned by the moving averages are 75.00% bullish. This bullish trend is reinforced by the strong signals currently being given by short-term moving averages. The Central Indicators scanner does not detect any result on moving averages that would impact this trend.
Technical indicators are strongly bullish, suggesting that the price increase should continue.
Caution: the Central Indicators scanner currently detects an excess:
CCI indicator: bearish divergence
Type : Bearish
Timeframe : Daily
Williams %R indicator is overbought : over -20
Type : Neutral
Timeframe : Daily
Pivot points : price is under support 1
Type : Neutral
Timeframe : Daily
An analysis of the price chart with the Central Patterns scanner (detector of chart patterns and resistances and supports) shows a result that can have an impact on the price change:
Near resistance of channel
Type : Bearish
Timeframe : Daily
For a small setback in the very short term, the Central Candlesticks scanner currently notes the presence of this bearish pattern in Japanese candlesticks:
Bearish engulfing lines
Type : Bearish
Timeframe : Daily
| S3 | S2 | S1 | R1 | Price | R2 | R3 | |
|---|---|---|---|---|---|---|---|
| ProTrendLines | 42.65 | 46.80 | 50.20 | 55.48 | 55.48 | 58.00 | 60.12 |
| Change (%) | -23.13% | -15.65% | -9.52% | 0% | - | +4.54% | +8.36% |
| Change | -12.83 | -8.68 | -5.28 | 0 | - | +2.52 | +4.64 |
| Level | Major | Intermediate | Minor | Major | - | Major | Minor |
Attention could also be paid to pivot points to set price objectives:
| Pivot points | S3 | S2 | S1 | PP | R1 | R2 | R3 |
|---|---|---|---|---|---|---|---|
| Standard | 54.47 | 54.94 | 55.45 | 55.92 | 56.43 | 56.90 | 57.41 |
| Camarilla | 55.69 | 55.78 | 55.87 | 55.96 | 56.05 | 56.14 | 56.23 |
| Woodie | 54.49 | 54.95 | 55.47 | 55.93 | 56.45 | 56.91 | 57.43 |
| Fibonacci | 54.94 | 55.31 | 55.55 | 55.92 | 56.29 | 56.53 | 56.90 |
| Pivot points | S3 | S2 | S1 | PP | R1 | R2 | R3 |
|---|---|---|---|---|---|---|---|
| Standard | 51.70 | 52.59 | 54.02 | 54.91 | 56.34 | 57.23 | 58.66 |
| Camarilla | 54.81 | 55.03 | 55.24 | 55.45 | 55.66 | 55.88 | 56.09 |
| Woodie | 51.97 | 52.73 | 54.29 | 55.05 | 56.61 | 57.37 | 58.93 |
| Fibonacci | 52.59 | 53.48 | 54.02 | 54.91 | 55.80 | 56.34 | 57.23 |
| Pivot points | S3 | S2 | S1 | PP | R1 | R2 | R3 |
|---|---|---|---|---|---|---|---|
| Standard | 42.06 | 44.38 | 48.80 | 51.12 | 55.54 | 57.86 | 62.28 |
| Camarilla | 51.37 | 51.98 | 52.60 | 53.22 | 53.84 | 54.46 | 55.07 |
| Woodie | 43.11 | 44.91 | 49.85 | 51.65 | 56.59 | 58.39 | 63.33 |
| Fibonacci | 44.38 | 46.96 | 48.55 | 51.12 | 53.70 | 55.29 | 57.86 |
Numerical data
The following are the details of the technical indicators and moving averages that were collected to generate this technical analysis:
| RSI (14): | 61.92 | |
| MACD (12,26,9): | 1.1500 | |
| Directional Movement: | 14.82 | |
| AROON (14): | 92.86 | |
| DEMA (21): | 55.26 | |
| Parabolic SAR (0,02-0,02-0,2): | 53.43 | |
| Elder Ray (13): | 1.27 | |
| Super Trend (3,10): | 52.36 | |
| Zig ZAG (10): | 55.49 | |
| VORTEX (21): | 1.0400 | |
| Stochastique (14,3,5): | 92.28 | |
| TEMA (21): | 55.96 | |
| Williams %R (14): | -14.00 | |
| Chande Momentum Oscillator (20): | 4.14 | |
| Repulse (5,40,3): | -0.4400 | |
| ROCnROLL: | 1 | |
| TRIX (15,9): | 0.2700 | |
| Courbe Coppock: | 12.05 |
| MA7: | 55.32 | |
| MA20: | 53.50 | |
| MA50: | 51.28 | |
| MA100: | 52.74 | |
| MAexp7: | 55.18 | |
| MAexp20: | 53.84 | |
| MAexp50: | 52.77 | |
| MAexp100: | 53.20 | |
| Price / MA7: | +0.29% | |
| Price / MA20: | +3.70% | |
| Price / MA50: | +8.19% | |
| Price / MA100: | +5.20% | |
| Price / MAexp7: | +0.54% | |
| Price / MAexp20: | +3.05% | |
| Price / MAexp50: | +5.14% | |
| Price / MAexp100: | +4.29% |
News
The last news published on BAYER AG NA O.N. at the time of the generation of this analysis was as follows:
- Grünenthal closes deal to acquire testosterone therapy Nebido™ from Bayer for €495 million
- Ginkgo and Bayer Sign Definitive Agreement to Build Agricultural Biologicals R&D Platform Capabilities
- Grünenthal acquires testosterone treatment Nebido™ from Bayer
- BWXT Medical Executes Commercial Agreement with Bayer for Supply of Actinium-225 Based Products
- Trive becomes Official Jersey Sleeve Partner of Bayer 04 Leverkusen Football Club
About author

Online


Add a comment
Comments
0 comments on the analysis BAYER AG NA O.N. - Daily