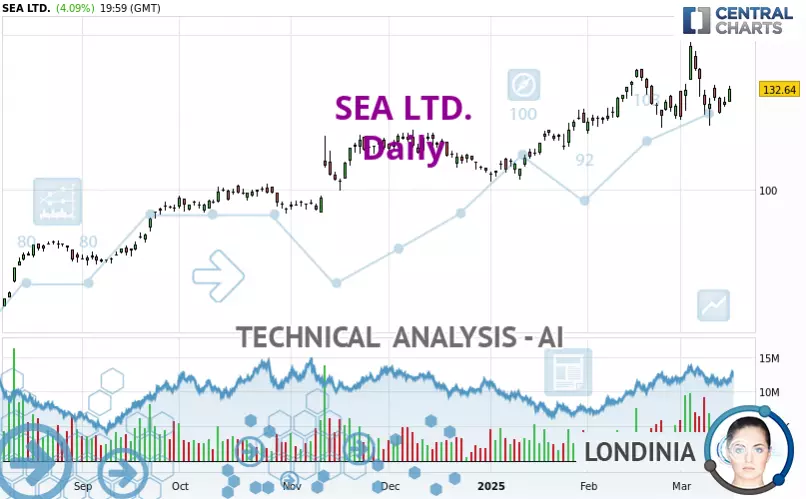
SEA LTD. - Daily - Technical analysis published on 03/18/2025 (GMT)
- 70
- 0
Click here for a new analysis!
- Timeframe : Daily
- - Analysis generated on
- Status : INVALID

Summary of the analysis

Additional analysis
Quotes
SEA LTD. rating 132.64 USD. The price has increased by +4.09% since the last closing and was between 128.47 USD and 133.43 USD. This implies that the price is at +3.25% from its lowest and at -0.59% from its highest.The Central Gaps scanner detects a bullish opening. A small advantage for buyers in the very short term.
Bullish opening
Type : Bullish
Timeframe : Openning
Here is a more detailed summary of the historical variations registered by SEA LTD.:
Technical
A technical analysis in Daily of this SEA LTD. chart shows a strongly bullish trend. The signals given by moving averages are 89.29% bullish. This strongly bullish trend seems to be running out of steam given the signals being given by short-term moving averages. An assessment of moving averages reveals several bullish signals that could impact this trend:
Bullish price crossover with Moving Average 20
Type : Bullish
Timeframe : Daily
Bullish price crossover with adaptative moving average 20
Type : Bullish
Timeframe : Daily
In fact, of the 18 technical indicators analysed by Central Analyzer, 8 are bullish, 6 are neutral and 4 are bearish. Other results related to technical indicators were also found by the Central Indicators scanner:
Pivot points : price is over resistance 3 (Daily)
Type : Neutral
Timeframe : Daily
RSI indicator is back over 50
Type : Bullish
Timeframe : Daily
Momentum indicator is back over 0
Type : Bullish
Timeframe : Daily
An analysis of the price chart with the Central Patterns scanner (detector of chart patterns and resistances and supports) shows a result that can have an impact on the price change:
Near support of channel
Type : Bullish
Timeframe : Daily
No result was found by the Central Candlesticks scanner on Japanese candlesticks.
| S3 | S2 | S1 | Price | R1 | R2 | R3 | |
|---|---|---|---|---|---|---|---|
| ProTrendLines | 88.59 | 117.41 | 128.27 | 132.64 | 138.62 | 146.31 | 173.95 |
| Change (%) | -33.21% | -11.48% | -3.29% | - | +4.51% | +10.31% | +31.14% |
| Change | -44.05 | -15.23 | -4.37 | - | +5.98 | +13.67 | +41.31 |
| Level | Major | Intermediate | Intermediate | - | Intermediate | Major | Minor |
To determine price objectives, it is also possible to use the pivot points. Here is the price position in relation to pivot points:
| Pivot points | S3 | S2 | S1 | PP | R1 | R2 | R3 |
|---|---|---|---|---|---|---|---|
| Standard | 122.89 | 124.78 | 126.11 | 128.00 | 129.33 | 131.22 | 132.55 |
| Camarilla | 126.55 | 126.84 | 127.14 | 127.43 | 127.73 | 128.02 | 128.32 |
| Woodie | 122.60 | 124.64 | 125.82 | 127.86 | 129.04 | 131.08 | 132.26 |
| Fibonacci | 124.78 | 126.01 | 126.77 | 128.00 | 129.23 | 129.99 | 131.22 |
| Pivot points | S3 | S2 | S1 | PP | R1 | R2 | R3 |
|---|---|---|---|---|---|---|---|
| Standard | 107.89 | 114.35 | 120.89 | 127.35 | 133.89 | 140.35 | 146.89 |
| Camarilla | 123.86 | 125.05 | 126.24 | 127.43 | 128.62 | 129.81 | 131.01 |
| Woodie | 107.93 | 114.37 | 120.93 | 127.37 | 133.93 | 140.37 | 146.93 |
| Fibonacci | 114.35 | 119.32 | 122.38 | 127.35 | 132.32 | 135.38 | 140.35 |
| Pivot points | S3 | S2 | S1 | PP | R1 | R2 | R3 |
|---|---|---|---|---|---|---|---|
| Standard | 96.27 | 107.24 | 117.25 | 128.22 | 138.23 | 149.20 | 159.21 |
| Camarilla | 121.50 | 123.42 | 125.35 | 127.27 | 129.19 | 131.12 | 133.04 |
| Woodie | 95.80 | 107.00 | 116.78 | 127.98 | 137.76 | 148.96 | 158.74 |
| Fibonacci | 107.24 | 115.25 | 120.20 | 128.22 | 136.23 | 141.18 | 149.20 |
Numerical data
The following is the status of the technical indicators and moving averages at the time of publication of this technical analysis:
| RSI (14): | 54.19 | |
| MACD (12,26,9): | 1.4900 | |
| Directional Movement: | 1.41 | |
| AROON (14): | 42.86 | |
| DEMA (21): | 132.06 | |
| Parabolic SAR (0,02-0,02-0,2): | 145.64 | |
| Elder Ray (13): | 0.86 | |
| Super Trend (3,10): | 121.48 | |
| Zig ZAG (10): | 132.64 | |
| VORTEX (21): | 0.8700 | |
| Stochastique (14,3,5): | 29.57 | |
| TEMA (21): | 130.50 | |
| Williams %R (14): | -56.05 | |
| Chande Momentum Oscillator (20): | 6.22 | |
| Repulse (5,40,3): | -0.1900 | |
| ROCnROLL: | 1 | |
| TRIX (15,9): | 0.2800 | |
| Courbe Coppock: | 1.57 |
| MA7: | 129.32 | |
| MA20: | 130.74 | |
| MA50: | 123.05 | |
| MA100: | 115.18 | |
| MAexp7: | 129.90 | |
| MAexp20: | 129.50 | |
| MAexp50: | 124.27 | |
| MAexp100: | 115.25 | |
| Price / MA7: | +2.57% | |
| Price / MA20: | +1.45% | |
| Price / MA50: | +7.79% | |
| Price / MA100: | +15.16% | |
| Price / MAexp7: | +2.11% | |
| Price / MAexp20: | +2.42% | |
| Price / MAexp50: | +6.74% | |
| Price / MAexp100: | +15.09% |
News
The latest news and videos published on SEA LTD. at the time of the analysis were as follows:
- FINAL DEADLINE TOMORROW: The Schall Law Firm Encourages Investors in Sea Limited with Losses of $500,000 to Contact the Firm
- SHAREHOLDER ACTION ALERT: The Schall Law Firm Encourages Investors in Sea Limited with Losses of $100,000 to Contact the Firm
- SHAREHOLDER ACTION NOTICE: The Schall Law Firm Encourages Investors in Sea Limited with Losses of $100,000 to Contact the Firm
- INVESTOR ACTION ALERT: The Schall Law Firm Encourages Investors in Sea Limited with Losses of $100,000 to Contact the Firm
About author
Online


Add a comment
Comments
0 comments on the analysis SEA LTD. - Daily