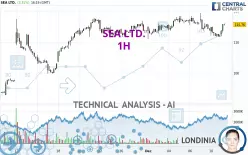
SEA LTD. - 1H - Technical analysis published on 12/11/2024 (GMT)
- 95
- 0
Click here for a new analysis!
- Timeframe : 1H
- - Analysis generated on
- Status : LEVEL MAINTAINED

Summary of the analysis

Additional analysis
Quotes
The SEA LTD. rating is 115.76 USD. The price registered an increase of +3.31% on the session and was traded between 111.95 USD and 116.00 USD over the period. The price is currently at +3.40% from its lowest and -0.21% from its highest.The Central Gaps scanner detects a bullish opening marking the presence of buyers ahead of sellers at the opening but not sufficiently marked to allow the price to register a quotation gap.
Bullish opening
Type : Bullish
Timeframe : Openning
Here is a more detailed summary of the historical variations registered by SEA LTD.:
Near a new HIGH record (1st january)
Type : Bullish
Timeframe : Weekly
Near a new HIGH record (1 month)
Type : Bullish
Timeframe : Weekly
Technical
Technical analysis of this 1H chart of SEA LTD. indicates that the overall trend is bullish. The signals given by moving averages are 78.57% bullish. This bullish trend is slowing down slightly given the slightly bullish signals of short-term moving averages. The Central Indicators scanner detects bullish signals on moving averages that could impact this trend:
Bullish trend reversal : Moving Average 50
Type : Bullish
Timeframe : 1 hour
Bullish trend reversal : adaptative moving average 20
Type : Bullish
Timeframe : 1 hour
Bullish trend reversal : adaptative moving average 50
Type : Bullish
Timeframe : 1 hour
In fact, Central Analyzer took into account 18 technical indicators and the result was as follows: 11 are bullish, 3 are neutral and 4 are bearish. Caution: the Central Indicators scanner currently detects an excess:
Williams %R indicator is overbought : over -20
Type : Neutral
Timeframe : 1 hour
Pivot points : price is over resistance 1
Type : Neutral
Timeframe : 1 hour
Momentum indicator is back over 0
Type : Bullish
Timeframe : 1 hour
Central Patterns, the market scanner focusing on chart patterns, resistances and supports found this result:
Near horizontal support
Type : Bullish
Timeframe : 1 hour
Central Candlesticks, the scanner specialised in Japanese candlesticks, detects a bearish signal that could support the hypothesis of a small drop in the very short term:
Bearish doji star
Type : Bearish
Timeframe : 1 hour
| S3 | S2 | S1 | Price | R1 | R2 | R3 | |
|---|---|---|---|---|---|---|---|
| ProTrendLines | 107.19 | 111.73 | 113.76 | 115.76 | 115.83 | 132.72 | 202.34 |
| Change (%) | -7.40% | -3.48% | -1.73% | - | +0.06% | +14.65% | +74.79% |
| Change | -8.57 | -4.03 | -2.00 | - | +0.07 | +16.96 | +86.58 |
| Level | Minor | Major | Minor | - | Major | Minor | Minor |
Attention could also be paid to pivot points to set price objectives:
| Pivot points | S3 | S2 | S1 | PP | R1 | R2 | R3 |
|---|---|---|---|---|---|---|---|
| Standard | 107.53 | 109.62 | 110.83 | 112.92 | 114.13 | 116.22 | 117.43 |
| Camarilla | 111.14 | 111.45 | 111.75 | 112.05 | 112.35 | 112.66 | 112.96 |
| Woodie | 107.10 | 109.40 | 110.40 | 112.70 | 113.70 | 116.00 | 117.00 |
| Fibonacci | 109.62 | 110.88 | 111.66 | 112.92 | 114.18 | 114.96 | 116.22 |
| Pivot points | S3 | S2 | S1 | PP | R1 | R2 | R3 |
|---|---|---|---|---|---|---|---|
| Standard | 104.39 | 107.70 | 111.97 | 115.28 | 119.55 | 122.86 | 127.13 |
| Camarilla | 114.17 | 114.86 | 115.56 | 116.25 | 116.95 | 117.64 | 118.34 |
| Woodie | 104.88 | 107.94 | 112.46 | 115.52 | 120.04 | 123.10 | 127.62 |
| Fibonacci | 107.70 | 110.59 | 112.38 | 115.28 | 118.17 | 119.96 | 122.86 |
| Pivot points | S3 | S2 | S1 | PP | R1 | R2 | R3 |
|---|---|---|---|---|---|---|---|
| Standard | 73.20 | 82.96 | 98.34 | 108.10 | 123.48 | 133.24 | 148.62 |
| Camarilla | 106.82 | 109.12 | 111.43 | 113.73 | 116.04 | 118.34 | 120.64 |
| Woodie | 76.02 | 84.37 | 101.16 | 109.51 | 126.30 | 134.65 | 151.44 |
| Fibonacci | 82.96 | 92.56 | 98.49 | 108.10 | 117.70 | 123.63 | 133.24 |
Numerical data
The following is the status of technical indicators and moving averages registered at the time this technical analysis was created:
| RSI (14): | 54.52 | |
| MACD (12,26,9): | -0.6900 | |
| Directional Movement: | 7.55 | |
| AROON (14): | -71.43 | |
| DEMA (21): | 113.44 | |
| Parabolic SAR (0,02-0,02-0,2): | 111.70 | |
| Elder Ray (13): | 1.82 | |
| Super Trend (3,10): | 116.08 | |
| Zig ZAG (10): | 115.94 | |
| VORTEX (21): | 0.9600 | |
| Stochastique (14,3,5): | 73.65 | |
| TEMA (21): | 113.48 | |
| Williams %R (14): | -6.39 | |
| Chande Momentum Oscillator (20): | 0.19 | |
| Repulse (5,40,3): | 2.2000 | |
| ROCnROLL: | 1 | |
| TRIX (15,9): | -0.0800 | |
| Courbe Coppock: | 3.14 |
| MA7: | 115.43 | |
| MA20: | 112.80 | |
| MA50: | 103.55 | |
| MA100: | 90.35 | |
| MAexp7: | 114.16 | |
| MAexp20: | 114.23 | |
| MAexp50: | 114.62 | |
| MAexp100: | 113.10 | |
| Price / MA7: | +0.29% | |
| Price / MA20: | +2.62% | |
| Price / MA50: | +11.79% | |
| Price / MA100: | +28.12% | |
| Price / MAexp7: | +1.40% | |
| Price / MAexp20: | +1.34% | |
| Price / MAexp50: | +0.99% | |
| Price / MAexp100: | +2.35% |
News
The last news published on SEA LTD. at the time of the generation of this analysis was as follows:
- FINAL DEADLINE TOMORROW: The Schall Law Firm Encourages Investors in Sea Limited with Losses of $500,000 to Contact the Firm
- SHAREHOLDER ACTION ALERT: The Schall Law Firm Encourages Investors in Sea Limited with Losses of $100,000 to Contact the Firm
- SHAREHOLDER ACTION NOTICE: The Schall Law Firm Encourages Investors in Sea Limited with Losses of $100,000 to Contact the Firm
- INVESTOR ACTION ALERT: The Schall Law Firm Encourages Investors in Sea Limited with Losses of $100,000 to Contact the Firm
About author
Online


Add a comment
Comments
0 comments on the analysis SEA LTD. - 1H