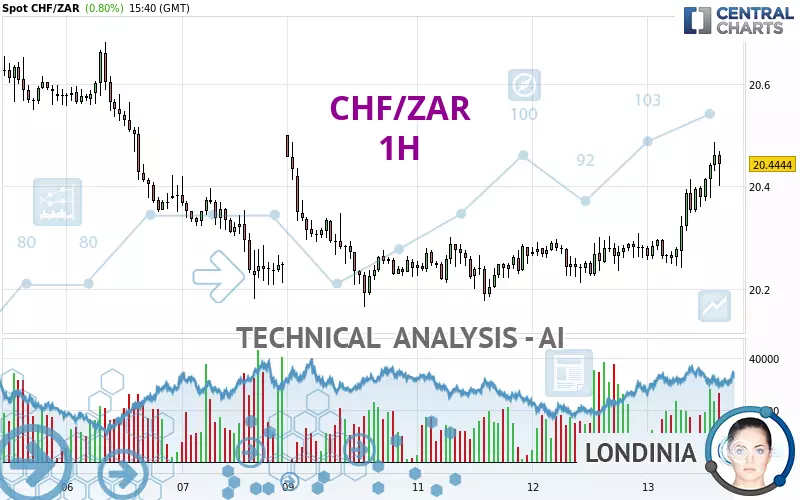
CHF/ZAR - 1H - Technical analysis published on 02/13/2025 (GMT)
- 74
- 0
Click here for a new analysis!
- Timeframe : 1H
- - Analysis generated on
- Status : TARGET REACHED

Summary of the analysis

Additional analysis
Quotes
CHF/ZAR rating 20.4443 ZAR. The price has increased by +0.80% since the last closing with the lowest point at 20.2408 ZAR and the highest point at 20.4858 ZAR. The deviation from the price is +1.01% for the low point and -0.20% for the high point.The Central Gaps scanner detects a bearish opening marking the presence of sellers ahead of buyers at the opening but not sufficiently marked to allow the price to register a quotation gap.
Bearish opening
Type : Bearish
Timeframe : Openning
Here is a more detailed summary of the historical variations registered by CHF/ZAR:
Near a new LOW record (1 year)
Type : Bearish
Timeframe : Weekly
Near a new HIGH record (1st january)
Type : Bullish
Timeframe : Weekly
Near a new HIGH record (1 month)
Type : Bullish
Timeframe : Weekly
Technical
Technical analysis of CHF/ZAR in 1H shows a strongly overall bullish trend. 89.29% of the signals given by moving averages are bullish. This strongly bullish trend is supported by the strong bullish signals given by short-term moving averages. There is no crossing of moving average by the price or crossing of moving averages between themselves.
The probability of a further increase is high given the direction of the technical indicators.
Caution: the Central Indicators scanner currently detects an excess:
CCI indicator is overbought : over 100
Type : Neutral
Timeframe : 1 hour
CCI indicator: bearish divergence
Type : Bearish
Timeframe : 1 hour
RSI indicator: bearish divergence
Type : Bearish
Timeframe : 1 hour
Pivot points : price is over resistance 3
Type : Neutral
Timeframe : 1 hour
An analysis of the price chart with the Central Patterns scanner (detector of chart patterns and resistances and supports) shows a result that can have an impact on the price change:
Resistance of channel is broken
Type : Bullish
Timeframe : 1 hour
Central Candlesticks, the scanner specialised in Japanese candlesticks, detects a bearish signal that could support the hypothesis of a small drop in the very short term:
Bearish engulfing lines
Type : Bearish
Timeframe : 1 hour
| S3 | S2 | S1 | Price | R1 | R2 | R3 | |
|---|---|---|---|---|---|---|---|
| ProTrendLines | 20.0807 | 20.1782 | 20.3392 | 20.4443 | 20.5016 | 20.6205 | 20.6811 |
| Change (%) | -1.78% | -1.30% | -0.51% | - | +0.28% | +0.86% | +1.16% |
| Change | -0.3636 | -0.2661 | -0.1051 | - | +0.0573 | +0.1762 | +0.2368 |
| Level | Intermediate | Intermediate | Major | - | Intermediate | Intermediate | Minor |
Pivot points can also be used to set your price objectives. Here is the price situation in relation to pivot points:
| Pivot points | S3 | S2 | S1 | PP | R1 | R2 | R3 |
|---|---|---|---|---|---|---|---|
| Standard | 20.1293 | 20.1709 | 20.2262 | 20.2678 | 20.3231 | 20.3647 | 20.4200 |
| Camarilla | 20.2548 | 20.2636 | 20.2725 | 20.2814 | 20.2903 | 20.2992 | 20.3081 |
| Woodie | 20.1361 | 20.1743 | 20.2330 | 20.2712 | 20.3299 | 20.3681 | 20.4268 |
| Fibonacci | 20.1709 | 20.2080 | 20.2308 | 20.2678 | 20.3049 | 20.3277 | 20.3647 |
| Pivot points | S3 | S2 | S1 | PP | R1 | R2 | R3 |
|---|---|---|---|---|---|---|---|
| Standard | 19.3763 | 19.7785 | 20.0137 | 20.4159 | 20.6511 | 21.0533 | 21.2885 |
| Camarilla | 20.0737 | 20.1321 | 20.1906 | 20.2490 | 20.3074 | 20.3659 | 20.4243 |
| Woodie | 19.2929 | 19.7368 | 19.9303 | 20.3742 | 20.5677 | 21.0116 | 21.2051 |
| Fibonacci | 19.7785 | 20.0220 | 20.1724 | 20.4159 | 20.6594 | 20.8098 | 21.0533 |
| Pivot points | S3 | S2 | S1 | PP | R1 | R2 | R3 |
|---|---|---|---|---|---|---|---|
| Standard | 19.4154 | 19.8244 | 20.1585 | 20.5675 | 20.9016 | 21.3106 | 21.6447 |
| Camarilla | 20.2882 | 20.3563 | 20.4244 | 20.4925 | 20.5606 | 20.6287 | 20.6969 |
| Woodie | 19.3779 | 19.8057 | 20.1210 | 20.5488 | 20.8641 | 21.2919 | 21.6072 |
| Fibonacci | 19.8244 | 20.1083 | 20.2837 | 20.5675 | 20.8514 | 21.0268 | 21.3106 |
Numerical data
The following is the status of the technical indicators and moving averages at the time of publication of this technical analysis:
| RSI (14): | 70.29 | |
| MACD (12,26,9): | 0.0459 | |
| Directional Movement: | 24.5084 | |
| AROON (14): | 50.0000 | |
| DEMA (21): | 20.4019 | |
| Parabolic SAR (0,02-0,02-0,2): | 20.3208 | |
| Elder Ray (13): | 0.0592 | |
| Super Trend (3,10): | 20.3136 | |
| Zig ZAG (10): | 20.4134 | |
| VORTEX (21): | 1.1797 | |
| Stochastique (14,3,5): | 89.10 | |
| TEMA (21): | 20.4365 | |
| Williams %R (14): | -20.00 | |
| Chande Momentum Oscillator (20): | 0.1828 | |
| Repulse (5,40,3): | 0.3829 | |
| ROCnROLL: | 1 | |
| TRIX (15,9): | 0.0208 | |
| Courbe Coppock: | 1.37 |
| MA7: | 20.3506 | |
| MA20: | 20.4477 | |
| MA50: | 20.4917 | |
| MA100: | 20.4414 | |
| MAexp7: | 20.4177 | |
| MAexp20: | 20.3534 | |
| MAexp50: | 20.3115 | |
| MAexp100: | 20.3177 | |
| Price / MA7: | +0.46% | |
| Price / MA20: | -0.02% | |
| Price / MA50: | -0.23% | |
| Price / MA100: | +0.01% | |
| Price / MAexp7: | +0.13% | |
| Price / MAexp20: | +0.45% | |
| Price / MAexp50: | +0.65% | |
| Price / MAexp100: | +0.62% |
About author
Online


Add a comment
Comments
0 comments on the analysis CHF/ZAR - 1H