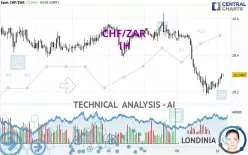
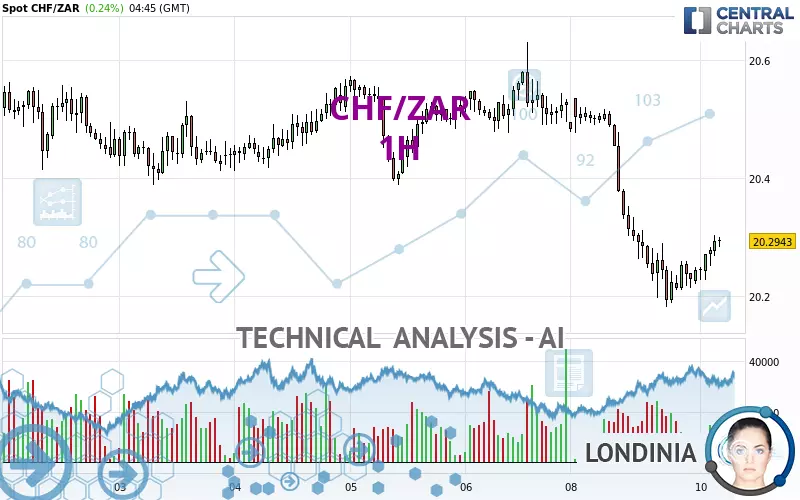
CHF/ZAR - 1H - Technical analysis published on 12/10/2024 (GMT)
- 104
- 0
Click here for a new analysis!
- Timeframe : 1H
- - Analysis generated on
- Status : TARGET REACHED
Summary of the analysis

Additional analysis
Quotes
CHF/ZAR rating 20.2943 ZAR. On the day, this instrument gained +0.24% and was traded between 20.2278 ZAR and 20.3038 ZAR over the period. The price is currently at +0.33% from its lowest and -0.05% from its highest.So that you have an overall view of the price change, here is a table showing the variations over several periods:
Near a new LOW record (1 year)
Type : Bearish
Timeframe : Weekly
Near a new LOW record (1st january)
Type : Bearish
Timeframe : Weekly
Near a new HIGH record (1 month)
Type : Bullish
Timeframe : Weekly
Technical
A technical analysis in 1H of this CHF/ZAR chart shows a bearish trend. 75.00% of the signals given by moving averages are bearish. Caution: as the signals currently given by short-term moving averages are rather neutral, the bearish trend could slow down. The Central Indicators market scanner is currently detecting a bullish signal that could impact this trend:
Bullish trend reversal : adaptative moving average 20
Type : Bullish
Timeframe : 1 hour
In fact, 12 technical indicators on 18 studied are currently bullish. Caution: the Central Indicators scanner currently detects an excess:
Williams %R indicator is overbought : over -20
Type : Neutral
Timeframe : 1 hour
Pivot points : price is under support 1
Type : Neutral
Timeframe : Weekly
An analysis of the price chart with the Central Patterns scanner (detector of chart patterns and resistances and supports) shows several results that can have an impact on the price change:
Near horizontal resistance
Type : Bearish
Timeframe : 1 hour
Resistance of channel is broken
Type : Bullish
Timeframe : 1 hour
The Central Candlesticks scanner, specialised in Japanese candlesticks, did not identify any signals.
| S3 | S2 | S1 | Price | R1 | R2 | R3 | |
|---|---|---|---|---|---|---|---|
| ProTrendLines | 20.0807 | 20.1822 | 20.2582 | 20.2943 | 20.3882 | 20.4883 | 20.5592 |
| Change (%) | -1.05% | -0.55% | -0.18% | - | +0.46% | +0.96% | +1.31% |
| Change | -0.2136 | -0.1121 | -0.0361 | - | +0.0939 | +0.1940 | +0.2649 |
| Level | Intermediate | Intermediate | Major | - | Major | Minor | Major |
Pivot points can also be used to set your price objectives. Here is the price situation in relation to pivot points:
| Pivot points | S3 | S2 | S1 | PP | R1 | R2 | R3 |
|---|---|---|---|---|---|---|---|
| Standard | 19.7522 | 19.9672 | 20.1063 | 20.3213 | 20.4604 | 20.6754 | 20.8145 |
| Camarilla | 20.1480 | 20.1805 | 20.2129 | 20.2454 | 20.2779 | 20.3103 | 20.3428 |
| Woodie | 19.7143 | 19.9482 | 20.0684 | 20.3023 | 20.4225 | 20.6564 | 20.7766 |
| Fibonacci | 19.9672 | 20.1025 | 20.1860 | 20.3213 | 20.4566 | 20.5401 | 20.6754 |
| Pivot points | S3 | S2 | S1 | PP | R1 | R2 | R3 |
|---|---|---|---|---|---|---|---|
| Standard | 20.1590 | 20.2735 | 20.4014 | 20.5159 | 20.6438 | 20.7583 | 20.8862 |
| Camarilla | 20.4626 | 20.4849 | 20.5071 | 20.5293 | 20.5515 | 20.5737 | 20.5960 |
| Woodie | 20.1657 | 20.2769 | 20.4081 | 20.5193 | 20.6505 | 20.7617 | 20.8929 |
| Fibonacci | 20.2735 | 20.3661 | 20.4233 | 20.5159 | 20.6085 | 20.6657 | 20.7583 |
| Pivot points | S3 | S2 | S1 | PP | R1 | R2 | R3 |
|---|---|---|---|---|---|---|---|
| Standard | 19.0663 | 19.4338 | 19.9588 | 20.3263 | 20.8513 | 21.2188 | 21.7438 |
| Camarilla | 20.2383 | 20.3201 | 20.4019 | 20.4837 | 20.5655 | 20.6473 | 20.7291 |
| Woodie | 19.1450 | 19.4732 | 20.0375 | 20.3657 | 20.9300 | 21.2582 | 21.8225 |
| Fibonacci | 19.4338 | 19.7748 | 19.9854 | 20.3263 | 20.6673 | 20.8779 | 21.2188 |
Numerical data
The following is the status of technical indicators and moving averages registered at the time this technical analysis was created:
| RSI (14): | 46.43 | |
| MACD (12,26,9): | -0.0367 | |
| Directional Movement: | -3.2906 | |
| AROON (14): | 71.4285 | |
| DEMA (21): | 20.2318 | |
| Parabolic SAR (0,02-0,02-0,2): | 20.2163 | |
| Elder Ray (13): | 0.0190 | |
| Super Trend (3,10): | 20.3638 | |
| Zig ZAG (10): | 20.2938 | |
| VORTEX (21): | 0.8976 | |
| Stochastique (14,3,5): | 91.14 | |
| TEMA (21): | 20.2398 | |
| Williams %R (14): | -7.73 | |
| Chande Momentum Oscillator (20): | 0.0505 | |
| Repulse (5,40,3): | 0.2133 | |
| ROCnROLL: | -1 | |
| TRIX (15,9): | -0.0400 | |
| Courbe Coppock: | 0.06 |
| MA7: | 20.4353 | |
| MA20: | 20.4539 | |
| MA50: | 20.3941 | |
| MA100: | 20.6420 | |
| MAexp7: | 20.2725 | |
| MAexp20: | 20.2896 | |
| MAexp50: | 20.3646 | |
| MAexp100: | 20.4175 | |
| Price / MA7: | -0.69% | |
| Price / MA20: | -0.78% | |
| Price / MA50: | -0.49% | |
| Price / MA100: | -1.68% | |
| Price / MAexp7: | +0.11% | |
| Price / MAexp20: | +0.02% | |
| Price / MAexp50: | -0.35% | |
| Price / MAexp100: | -0.60% |
About author
Online


Add a comment
Comments
0 comments on the analysis CHF/ZAR - 1H