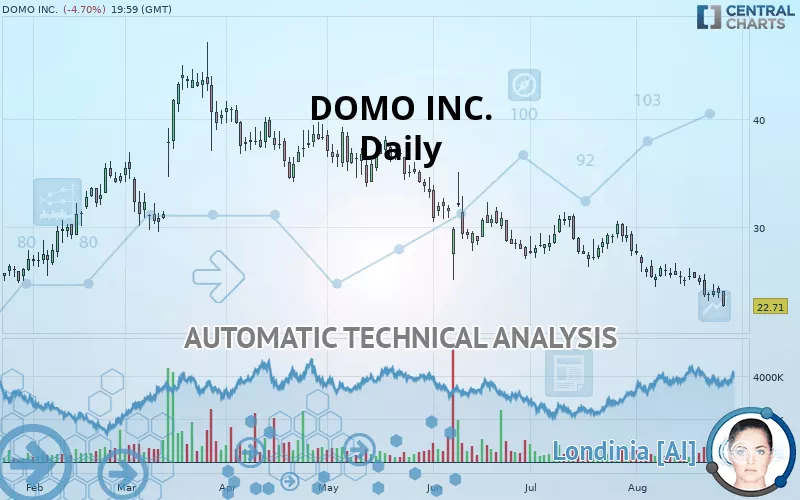
DOMO INC. - Daily - Technical analysis published on 08/28/2019 (GMT)
- 256
- 0
- Who voted?
Click here for a new analysis!
- Timeframe : Daily
- - Analysis generated on
- Status : INVALID
Summary of the analysis

Additional analysis
Quotes
DOMO INC. rating 22.71 USD. The price is lower by -4.70% since the last closing and was traded between 22.58 USD and 24.09 USD over the period. The price is currently at +0.58% from its lowest and -5.73% from its highest.A bullish opening was detected by the Central Gaps scanner. Buyers are trying to impose a bullish momentum in the very short term.
Bullish opening
Type : Bullish
Timeframe : Openning
So that you have an overall view of the price change, here is a table showing the variations over several periods:
Technical
Technical analysis of DOMO INC. in Daily shows a overall strongly bearish trend. The signals given by moving averages are 92.86% bearish. This strong bearish trend is confirmed by the strong signals currently being given by short-term moving averages. The Central Indicators market scanner currently does not detect any result that concerns moving averages.
Technical indicators are bearish. There is still some doubt about the decline in the price.
But beware of excesses. The Central Indicators scanner currently detects this:
RSI indicator is oversold : under 30
Type : Neutral
Timeframe : Daily
CCI indicator is oversold : under -100
Type : Neutral
Timeframe : Daily
Williams %R indicator is oversold : under -80
Type : Neutral
Timeframe : Daily
Pivot points : price is under support 1
Type : Neutral
Timeframe : Weekly
Pivot points : price is under support 3
Type : Neutral
Timeframe : Daily
The analysis of the price chart with Central Patterns scanners does not return any result.
The Central Candlesticks scanner, specialised in Japanese candlesticks, did not identify any signals.
| S3 | S2 | S1 | Price | R1 | R2 | R3 | |
|---|---|---|---|---|---|---|---|
| ProTrendLines | 14.17 | 16.47 | 19.63 | 22.71 | 23.69 | 30.30 | 38.70 |
| Change (%) | -37.60% | -27.48% | -13.56% | - | +4.32% | +33.42% | +70.41% |
| Change | -8.54 | -6.24 | -3.08 | - | +0.98 | +7.59 | +15.99 |
| Level | Minor | Major | Minor | - | Minor | Major | Minor |
Pivot points can also be used to set your price objectives. Here is the price situation in relation to pivot points:
| Pivot points | S3 | S2 | S1 | PP | R1 | R2 | R3 |
|---|---|---|---|---|---|---|---|
| Standard | 22.13 | 22.76 | 23.30 | 23.93 | 24.46 | 25.10 | 25.63 |
| Camarilla | 23.51 | 23.62 | 23.72 | 23.83 | 23.94 | 24.04 | 24.15 |
| Woodie | 22.08 | 22.74 | 23.25 | 23.90 | 24.41 | 25.07 | 25.58 |
| Fibonacci | 22.76 | 23.21 | 23.48 | 23.93 | 24.37 | 24.65 | 25.10 |
| Pivot points | S3 | S2 | S1 | PP | R1 | R2 | R3 |
|---|---|---|---|---|---|---|---|
| Standard | 20.27 | 21.72 | 22.90 | 24.35 | 25.53 | 26.98 | 28.16 |
| Camarilla | 23.36 | 23.60 | 23.84 | 24.08 | 24.32 | 24.56 | 24.80 |
| Woodie | 20.14 | 21.65 | 22.77 | 24.28 | 25.40 | 26.91 | 28.03 |
| Fibonacci | 21.72 | 22.73 | 23.35 | 24.35 | 25.36 | 25.98 | 26.98 |
| Pivot points | S3 | S2 | S1 | PP | R1 | R2 | R3 |
|---|---|---|---|---|---|---|---|
| Standard | 20.56 | 23.44 | 25.59 | 28.47 | 30.62 | 33.50 | 35.65 |
| Camarilla | 26.36 | 26.82 | 27.28 | 27.74 | 28.20 | 28.66 | 29.12 |
| Woodie | 20.20 | 23.26 | 25.23 | 28.29 | 30.26 | 33.32 | 35.29 |
| Fibonacci | 23.44 | 25.36 | 26.55 | 28.47 | 30.39 | 31.58 | 33.50 |
Numerical data
The following is the status of technical indicators and moving averages registered at the time this technical analysis was created:
| RSI (14): | 27.33 | |
| MACD (12,26,9): | -1.2600 | |
| Directional Movement: | -12.15 | |
| AROON (14): | -71.43 | |
| DEMA (21): | 23.66 | |
| Parabolic SAR (0,02-0,02-0,2): | 24.90 | |
| Elder Ray (13): | -1.30 | |
| Super Trend (3,10): | 27.09 | |
| Zig ZAG (10): | 22.71 | |
| VORTEX (21): | 0.7500 | |
| Stochastique (14,3,5): | 15.47 | |
| TEMA (21): | 23.36 | |
| Williams %R (14): | -96.78 | |
| Chande Momentum Oscillator (20): | -3.18 | |
| Repulse (5,40,3): | -10.3400 | |
| ROCnROLL: | 2 | |
| TRIX (15,9): | -0.5800 | |
| Courbe Coppock: | 18.15 |
| MA7: | 24.05 | |
| MA20: | 25.33 | |
| MA50: | 27.48 | |
| MA100: | 31.41 | |
| MAexp7: | 23.94 | |
| MAexp20: | 25.29 | |
| MAexp50: | 27.46 | |
| MAexp100: | 29.09 | |
| Price / MA7: | -5.57% | |
| Price / MA20: | -10.34% | |
| Price / MA50: | -17.36% | |
| Price / MA100: | -27.70% | |
| Price / MAexp7: | -5.14% | |
| Price / MAexp20: | -10.20% | |
| Price / MAexp50: | -17.30% | |
| Price / MAexp100: | -21.93% |
News
Don"t forget to follow the news on DOMO INC.. At the time of publication of this analysis, the latest news was as follows:
- Domo Ranks #7 on Utah Business Fast 50 List
- Domo Named to Constellation ShortList™ for Cloud-Based Business Intelligence and Analytics Platforms
- Domo to Present at the Deutsche Bank 2019 Technology Conference
- TaylorMade Expands Its Use of Domo in Japan to Support its Global Culture of Innovation
- Domo Announces Timing of its Second Quarter Fiscal 2020 Results Conference Call
About author

Online


Add a comment
Comments
0 comments on the analysis DOMO INC. - Daily