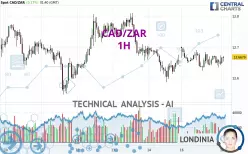
CAD/ZAR - 1H - Technical analysis published on 03/18/2025 (GMT)
- 123
- 0
- Timeframe : 1H
- - Analysis generated on
- Status : NEUTRAL

Summary of the analysis

Additional analysis
Quotes
The CAD/ZAR rating is 12.6682 ZAR. The price registered an increase of +0.18% on the session and was traded between 12.6456 ZAR and 12.6710 ZAR over the period. The price is currently at +0.18% from its lowest and -0.02% from its highest.The Central Gaps scanner detects a bullish opening marking the presence of buyers ahead of sellers at the opening but not sufficiently marked to allow the price to register a quotation gap.
Bullish opening
Type : Bullish
Timeframe : Openning
So that you have an overall view of the price change, here is a table showing the variations over several periods:
Near a new LOW record (1 year)
Type : Bearish
Timeframe : Weekly
Near a new LOW record (1st january)
Type : Bearish
Timeframe : Weekly
Near a new HIGH record (1 month)
Type : Bullish
Timeframe : Weekly
Technical
Technical analysis of this 1H chart of CAD/ZAR indicates that the overall trend is slightly bearish. 53.57% of the signals given by moving averages are bearish. Caution: the slightly bullish signals currently being given by short-term moving averages indicate that this overall trend could be reversed. The Central Indicators scanner detects a bullish signal on moving averages that could impact this trend:
Bullish trend reversal : adaptative moving average 20
Type : Bullish
Timeframe : 1 hour
In fact, Central Analyzer took into account 18 technical indicators and the result was as follows: 8 are bullish, 6 are neutral and 4 are bearish. Central Indicators, the scanner specialised in technical indicators, has identified these signals:
Price is back under the pivot point (Daily)
Type : Bearish
Timeframe : Weekly
Momentum indicator is back under 0
Type : Bearish
Timeframe : 1 hour
Williams %R indicator is back over -50
Type : Bullish
Timeframe : 1 hour
No signals are given by Central Patterns, a market scanner specialised in chart patterns, resistances and supports.
No result was found by the Central Candlesticks scanner on Japanese candlesticks.
| S3 | S2 | S1 | Price | R1 | R2 | R3 | |
|---|---|---|---|---|---|---|---|
| ProTrendLines | 12.5860 | 12.6207 | 12.6563 | 12.6682 | 12.7008 | 12.7337 | 12.8246 |
| Change (%) | -0.65% | -0.37% | -0.09% | - | +0.26% | +0.52% | +1.23% |
| Change | -0.0822 | -0.0475 | -0.0119 | - | +0.0326 | +0.0655 | +0.1564 |
| Level | Intermediate | Intermediate | Minor | - | Minor | Intermediate | Intermediate |
Attention could also be paid to pivot points to set price objectives:
| Pivot points | S3 | S2 | S1 | PP | R1 | R2 | R3 |
|---|---|---|---|---|---|---|---|
| Standard | 12.5347 | 12.5787 | 12.6124 | 12.6564 | 12.6901 | 12.7341 | 12.7678 |
| Camarilla | 12.6247 | 12.6319 | 12.6390 | 12.6461 | 12.6532 | 12.6604 | 12.6675 |
| Woodie | 12.5296 | 12.5761 | 12.6073 | 12.6538 | 12.6850 | 12.7315 | 12.7627 |
| Fibonacci | 12.5787 | 12.6084 | 12.6267 | 12.6564 | 12.6861 | 12.7044 | 12.7341 |
| Pivot points | S3 | S2 | S1 | PP | R1 | R2 | R3 |
|---|---|---|---|---|---|---|---|
| Standard | 12.2572 | 12.4018 | 12.5207 | 12.6653 | 12.7842 | 12.9288 | 13.0477 |
| Camarilla | 12.5671 | 12.5913 | 12.6155 | 12.6396 | 12.6638 | 12.6879 | 12.7121 |
| Woodie | 12.2444 | 12.3954 | 12.5079 | 12.6589 | 12.7714 | 12.9224 | 13.0349 |
| Fibonacci | 12.4018 | 12.5025 | 12.5646 | 12.6653 | 12.7660 | 12.8281 | 12.9288 |
| Pivot points | S3 | S2 | S1 | PP | R1 | R2 | R3 |
|---|---|---|---|---|---|---|---|
| Standard | 12.4353 | 12.6008 | 12.7620 | 12.9275 | 13.0887 | 13.2542 | 13.4154 |
| Camarilla | 12.8334 | 12.8633 | 12.8933 | 12.9232 | 12.9532 | 12.9831 | 13.0130 |
| Woodie | 12.4332 | 12.5997 | 12.7599 | 12.9264 | 13.0866 | 13.2531 | 13.4133 |
| Fibonacci | 12.6008 | 12.7256 | 12.8027 | 12.9275 | 13.0523 | 13.1294 | 13.2542 |
Numerical data
The following is the status of the technical indicators and moving averages at the time of publication of this technical analysis:
| RSI (14): | 49.54 | |
| MACD (12,26,9): | -0.0015 | |
| Directional Movement: | 1.6498 | |
| AROON (14): | 14.2857 | |
| DEMA (21): | 12.6540 | |
| Parabolic SAR (0,02-0,02-0,2): | 12.6340 | |
| Elder Ray (13): | 0.0004 | |
| Super Trend (3,10): | 12.6124 | |
| Zig ZAG (10): | 12.6558 | |
| VORTEX (21): | 0.9845 | |
| Stochastique (14,3,5): | 49.89 | |
| TEMA (21): | 12.6575 | |
| Williams %R (14): | -52.26 | |
| Chande Momentum Oscillator (20): | 0.0173 | |
| Repulse (5,40,3): | 0.0177 | |
| ROCnROLL: | 2 | |
| TRIX (15,9): | -0.0017 | |
| Courbe Coppock: | 0.04 |
| MA7: | 12.6738 | |
| MA20: | 12.8013 | |
| MA50: | 12.9124 | |
| MA100: | 12.8619 | |
| MAexp7: | 12.6553 | |
| MAexp20: | 12.6576 | |
| MAexp50: | 12.6657 | |
| MAexp100: | 12.6809 | |
| Price / MA7: | -0.04% | |
| Price / MA20: | -1.04% | |
| Price / MA50: | -1.89% | |
| Price / MA100: | -1.51% | |
| Price / MAexp7: | +0.10% | |
| Price / MAexp20: | +0.08% | |
| Price / MAexp50: | +0.02% | |
| Price / MAexp100: | -0.10% |
About author
Online


Add a comment
Comments
0 comments on the analysis CAD/ZAR - 1H