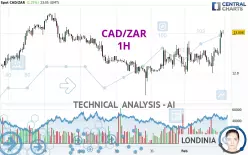
CAD/ZAR - 1H - Technical analysis published on 02/03/2025 (GMT)
- 124
- 0
Click here for a new analysis!
- Timeframe : 1H
- - Analysis generated on
- Status : TARGET REACHED

Summary of the analysis

Additional analysis
Quotes
The CAD/ZAR rating is 13.0060 ZAR. On the day, this instrument gained +1.25% and was traded between 12.7924 ZAR and 13.0178 ZAR over the period. The price is currently at +1.67% from its lowest and -0.09% from its highest.The Central Gaps scanner detects a bearish opening marking the presence of sellers ahead of buyers at the opening but not sufficiently marked to allow the price to register a quotation gap.
Bearish opening
Type : Bearish
Timeframe : Openning
So that you have an overall view of the price change, here is a table showing the variations over several periods:
Near a new LOW record (1 year)
Type : Bearish
Timeframe : Weekly
Near a new HIGH record (1st january)
Type : Bullish
Timeframe : Weekly
Near a new HIGH record (1 month)
Type : Bullish
Timeframe : Weekly
Technical
A technical analysis in 1H of this CAD/ZAR chart shows a strongly bullish trend. 85.71% of the signals given by moving averages are bullish. This strongly bullish trend is supported by the strong bullish signals given by short-term moving averages. The Central Indicators market scanner currently does not detect any result that concerns moving averages.
An assessment of technical indicators shows a strong bullish signal.
Caution: the Central Indicators scanner currently detects an excess:
CCI indicator is overbought : over 100
Type : Neutral
Timeframe : 1 hour
Previous candle closed over Bollinger bands
Type : Neutral
Timeframe : 1 hour
Williams %R indicator is overbought : over -20
Type : Neutral
Timeframe : 1 hour
Pivot points : price is over resistance 1
Type : Neutral
Timeframe : 1 hour
Price is back over the pivot point
Type : Bullish
Timeframe : Weekly
An analysis of the price chart with the Central Patterns scanner (detector of chart patterns and resistances and supports) shows several results that can have an impact on the price change:
Near horizontal resistance
Type : Bearish
Timeframe : 1 hour
Resistance of channel is broken
Type : Bullish
Timeframe : 1 hour
The Central Candlesticks scanner, specialised in Japanese candlesticks, did not identify any signals.
| S3 | S2 | S1 | Price | R1 | R2 | R3 | |
|---|---|---|---|---|---|---|---|
| ProTrendLines | 12.8299 | 12.9255 | 12.9947 | 13.0060 | 13.0295 | 13.1029 | 13.2931 |
| Change (%) | -1.35% | -0.62% | -0.09% | - | +0.18% | +0.75% | +2.21% |
| Change | -0.1761 | -0.0805 | -0.0113 | - | +0.0235 | +0.0969 | +0.2871 |
| Level | Intermediate | Intermediate | Minor | - | Intermediate | Intermediate | Major |
Attention could also be paid to pivot points to set price objectives:
| Pivot points | S3 | S2 | S1 | PP | R1 | R2 | R3 |
|---|---|---|---|---|---|---|---|
| Standard | 12.6376 | 12.7171 | 12.7813 | 12.8608 | 12.9250 | 13.0045 | 13.0687 |
| Camarilla | 12.8060 | 12.8192 | 12.8323 | 12.8455 | 12.8587 | 12.8719 | 12.8850 |
| Woodie | 12.6300 | 12.7133 | 12.7737 | 12.8570 | 12.9174 | 13.0007 | 13.0611 |
| Fibonacci | 12.7171 | 12.7720 | 12.8059 | 12.8608 | 12.9157 | 12.9496 | 13.0045 |
| Pivot points | S3 | S2 | S1 | PP | R1 | R2 | R3 |
|---|---|---|---|---|---|---|---|
| Standard | 12.2359 | 12.4609 | 12.6532 | 12.8782 | 13.0705 | 13.2955 | 13.4878 |
| Camarilla | 12.7307 | 12.7690 | 12.8073 | 12.8455 | 12.8838 | 12.9220 | 12.9603 |
| Woodie | 12.2196 | 12.4527 | 12.6369 | 12.8700 | 13.0542 | 13.2873 | 13.4715 |
| Fibonacci | 12.4609 | 12.6203 | 12.7188 | 12.8782 | 13.0376 | 13.1361 | 13.2955 |
| Pivot points | S3 | S2 | S1 | PP | R1 | R2 | R3 |
|---|---|---|---|---|---|---|---|
| Standard | 11.9379 | 12.3119 | 12.5787 | 12.9527 | 13.2195 | 13.5935 | 13.8603 |
| Camarilla | 12.6693 | 12.7280 | 12.7868 | 12.8455 | 12.9042 | 12.9630 | 13.0217 |
| Woodie | 11.8843 | 12.2851 | 12.5251 | 12.9259 | 13.1659 | 13.5667 | 13.8067 |
| Fibonacci | 12.3119 | 12.5567 | 12.7079 | 12.9527 | 13.1975 | 13.3487 | 13.5935 |
Numerical data
The following is the status of the technical indicators and moving averages at the time of publication of this technical analysis:
| RSI (14): | 66.59 | |
| MACD (12,26,9): | 0.0206 | |
| Directional Movement: | 17.8859 | |
| AROON (14): | 35.7142 | |
| DEMA (21): | 12.9218 | |
| Parabolic SAR (0,02-0,02-0,2): | 12.8140 | |
| Elder Ray (13): | 0.0776 | |
| Super Trend (3,10): | 12.8392 | |
| Zig ZAG (10): | 12.9929 | |
| VORTEX (21): | 1.1290 | |
| Stochastique (14,3,5): | 81.03 | |
| TEMA (21): | 12.9355 | |
| Williams %R (14): | -9.88 | |
| Chande Momentum Oscillator (20): | 0.0768 | |
| Repulse (5,40,3): | 0.3948 | |
| ROCnROLL: | 1 | |
| TRIX (15,9): | 0.0101 | |
| Courbe Coppock: | 0.60 |
| MA7: | 12.9093 | |
| MA20: | 13.0042 | |
| MA50: | 12.9022 | |
| MA100: | 12.8536 | |
| MAexp7: | 12.9325 | |
| MAexp20: | 12.8995 | |
| MAexp50: | 12.8823 | |
| MAexp100: | 12.8857 | |
| Price / MA7: | +0.75% | |
| Price / MA20: | +0.01% | |
| Price / MA50: | +0.80% | |
| Price / MA100: | +1.19% | |
| Price / MAexp7: | +0.57% | |
| Price / MAexp20: | +0.83% | |
| Price / MAexp50: | +0.96% | |
| Price / MAexp100: | +0.93% |
About author
Online


Add a comment
Comments
0 comments on the analysis CAD/ZAR - 1H