| Open: | - |
| Change: | - |
| Volume: | - |
| Low: | - |
| High: | - |
| High / Low range: | - |
| Type: | Forex |
| Ticker: | CADSGD |
| ISIN: |
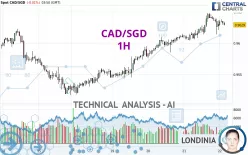
CAD/SGD - 1H - Technical analysis published on 11/22/2024 (GMT)
- 99
- 0
- 11/22/2024 - 03:50
Click here for a new analysis!
- Timeframe : 1H
- - Analysis generated on 11/22/2024 - 03:50
- Status : TARGET REACHED

Summary of the analysis

Additional analysis
Quotes
The CAD/SGD rating is 0.9629 SGD. The price registered a decrease of -0.01% on the session with the lowest point at 0.9627 SGD and the highest point at 0.9638 SGD. The deviation from the price is +0.02% for the low point and -0.09% for the high point.The Central Gaps scanner detects a bearish opening. A small advantage for sellers in the very short term.
Bearish opening
Type : Bearish
Timeframe : Openning
So that you have an overall view of the price change, here is a table showing the variations over several periods:
Near a new LOW record (5 years)
Type : Bearish
Timeframe : Weekly
Near a new HIGH record (1 year)
Type : Bullish
Timeframe : Weekly
Near a new HIGH record (1st january)
Type : Bullish
Timeframe : Weekly
Near a new LOW record (1 month)
Type : Bearish
Timeframe : Weekly
Technical
Technical analysis of CAD/SGD in 1H shows an overall bullish trend. The signals given by moving averages are 78.57% bullish. This bullish trend could slow down given the neutral signals currently being given by short-term moving averages. An assessment of moving averages reveals a bearish signal that could impact this trend:
Bearish price crossover with Moving Average 20
Type : Bearish
Timeframe : 1 hour
In fact, of the 18 technical indicators analysed by Central Analyzer, 3 are bullish, 9 are neutral and 6 are bearish. Central Indicators, the detector scanner for these technical indicators has recently detected several signals:
Pivot points : price is over resistance 1
Type : Neutral
Timeframe : Weekly
Momentum indicator is back under 0
Type : Bearish
Timeframe : 1 hour
Williams %R indicator is back under -50
Type : Bearish
Timeframe : 1 hour
Central Patterns, the market scanner focusing on chart patterns, resistances and supports found these results:
Near horizontal resistance
Type : Bearish
Timeframe : 1 hour
Resistance of channel is broken
Type : Bullish
Timeframe : 1 hour
No result was found by the Central Candlesticks scanner on Japanese candlesticks.
| S3 | S2 | S1 | Price | R1 | R2 | R3 | |
|---|---|---|---|---|---|---|---|
| ProTrendLines | 0.9545 | 0.9562 | 0.9612 | 0.9629 | 0.9648 | 0.9683 | 0.9873 |
| Change (%) | -0.87% | -0.70% | -0.18% | - | +0.20% | +0.56% | +2.53% |
| Change | -0.0084 | -0.0067 | -0.0017 | - | +0.0019 | +0.0054 | +0.0244 |
| Level | Intermediate | Major | Intermediate | - | Intermediate | Major | Minor |
To determine price objectives, it is also possible to use the pivot points. Here is the price position in relation to pivot points:
| Pivot points | S3 | S2 | S1 | PP | R1 | R2 | R3 |
|---|---|---|---|---|---|---|---|
| Standard | 0.9563 | 0.9583 | 0.9607 | 0.9627 | 0.9651 | 0.9671 | 0.9695 |
| Camarilla | 0.9618 | 0.9622 | 0.9626 | 0.9630 | 0.9634 | 0.9638 | 0.9642 |
| Woodie | 0.9564 | 0.9584 | 0.9608 | 0.9628 | 0.9652 | 0.9672 | 0.9696 |
| Fibonacci | 0.9583 | 0.9600 | 0.9611 | 0.9627 | 0.9644 | 0.9655 | 0.9671 |
| Pivot points | S3 | S2 | S1 | PP | R1 | R2 | R3 |
|---|---|---|---|---|---|---|---|
| Standard | 0.9372 | 0.9442 | 0.9484 | 0.9554 | 0.9596 | 0.9666 | 0.9708 |
| Camarilla | 0.9496 | 0.9507 | 0.9517 | 0.9527 | 0.9537 | 0.9548 | 0.9558 |
| Woodie | 0.9359 | 0.9435 | 0.9471 | 0.9547 | 0.9583 | 0.9659 | 0.9695 |
| Fibonacci | 0.9442 | 0.9485 | 0.9511 | 0.9554 | 0.9597 | 0.9623 | 0.9666 |
| Pivot points | S3 | S2 | S1 | PP | R1 | R2 | R3 |
|---|---|---|---|---|---|---|---|
| Standard | 0.9245 | 0.9349 | 0.9410 | 0.9514 | 0.9575 | 0.9679 | 0.9740 |
| Camarilla | 0.9425 | 0.9440 | 0.9455 | 0.9470 | 0.9485 | 0.9500 | 0.9515 |
| Woodie | 0.9223 | 0.9338 | 0.9388 | 0.9503 | 0.9553 | 0.9668 | 0.9718 |
| Fibonacci | 0.9349 | 0.9412 | 0.9451 | 0.9514 | 0.9577 | 0.9616 | 0.9679 |
Numerical data
The following is the status of the technical indicators and moving averages at the time of publication of this technical analysis:
| RSI (14): | 56.13 | |
| MACD (12,26,9): | 0.0006 | |
| Directional Movement: | -6.6677 | |
| AROON (14): | 21.4286 | |
| DEMA (21): | 0.9638 | |
| Parabolic SAR (0,02-0,02-0,2): | 0.9645 | |
| Elder Ray (13): | -0.0001 | |
| Super Trend (3,10): | 0.9614 | |
| Zig ZAG (10): | 0.9631 | |
| VORTEX (21): | 1.1005 | |
| Stochastique (14,3,5): | 50.98 | |
| TEMA (21): | 0.9635 | |
| Williams %R (14): | -55.88 | |
| Chande Momentum Oscillator (20): | -0.0011 | |
| Repulse (5,40,3): | -0.0574 | |
| ROCnROLL: | -1 | |
| TRIX (15,9): | 0.0113 | |
| Courbe Coppock: | 0.18 |
| MA7: | 0.9585 | |
| MA20: | 0.9549 | |
| MA50: | 0.9538 | |
| MA100: | 0.9612 | |
| MAexp7: | 0.9632 | |
| MAexp20: | 0.9629 | |
| MAexp50: | 0.9614 | |
| MAexp100: | 0.9597 | |
| Price / MA7: | +0.46% | |
| Price / MA20: | +0.84% | |
| Price / MA50: | +0.95% | |
| Price / MA100: | +0.18% | |
| Price / MAexp7: | -0.03% | |
| Price / MAexp20: | -0% | |
| Price / MAexp50: | +0.16% | |
| Price / MAexp100: | +0.33% |
About author
Online


Add a comment
Comments
0 comments on the analysis CAD/SGD - 1H