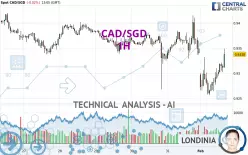
CAD/SGD - 1H - Technical analysis published on 02/03/2025 (GMT)
- 112
- 0
Click here for a new analysis!
- Timeframe : 1H
- - Analysis generated on
- Status : INVALID

Summary of the analysis

Additional analysis
Quotes
CAD/SGD rating 0.9338 SGD. The price is lower by -0.02% since the last closing and was between 0.9256 SGD and 0.9349 SGD. This implies that the price is at +0.89% from its lowest and at -0.12% from its highest.So that you have an overall view of the price change, here is a table showing the variations over several periods:
New LOW record (5 years)
Type : Bearish
Timeframe : Weekly
New LOW record (1 year)
Type : Bearish
Timeframe : Weekly
Near a new HIGH record (1st january)
Type : Bullish
Timeframe : Weekly
New LOW record (1st january)
Type : Bearish
Timeframe : Weekly
Near a new HIGH record (1 month)
Type : Bullish
Timeframe : Weekly
New LOW record (1 month)
Type : Bearish
Timeframe : Weekly
Technical
Technical analysis of CAD/SGD in 1H shows an overall bearish trend. The signals given by moving averages are at 67.86% bearish. This bearish trend could slow down given the slightly bullish signals currently being given by short-term moving averages. There is no crossing of moving average by the price or crossing of moving averages between themselves.
An assessment of technical indicators shows a moderate bullish signal.
Central Indicators, the scanner specialised in technical indicators, has identified this signal:
Pivot points : price is under support 1
Type : Neutral
Timeframe : 1 hour
An analysis of the price chart with the Central Patterns scanner (detector of chart patterns and resistances and supports) shows several results that can have an impact on the price change:
Near horizontal support
Type : Bullish
Timeframe : 1 hour
Support of channel is broken
Type : Bearish
Timeframe : 1 hour
The Central Candlesticks scanner, specialised in Japanese candlesticks, did not identify any signals.
| S1 | R1 | Price | R2 | R3 | |
|---|---|---|---|---|---|
| ProTrendLines | 0.9267 | 0.9338 | 0.9338 | 0.9354 | 0.9385 |
| Change (%) | -0.76% | 0% | - | +0.17% | +0.50% |
| Change | -0.0071 | 0 | - | +0.0016 | +0.0047 |
| Level | Minor | Intermediate | - | Minor | Intermediate |
Attention could also be paid to pivot points to set price objectives:
| Pivot points | S3 | S2 | S1 | PP | R1 | R2 | R3 |
|---|---|---|---|---|---|---|---|
| Standard | 0.9222 | 0.9275 | 0.9308 | 0.9361 | 0.9394 | 0.9447 | 0.9480 |
| Camarilla | 0.9316 | 0.9324 | 0.9332 | 0.9340 | 0.9348 | 0.9356 | 0.9364 |
| Woodie | 0.9211 | 0.9270 | 0.9297 | 0.9356 | 0.9383 | 0.9442 | 0.9469 |
| Fibonacci | 0.9275 | 0.9308 | 0.9329 | 0.9361 | 0.9394 | 0.9415 | 0.9447 |
| Pivot points | S3 | S2 | S1 | PP | R1 | R2 | R3 |
|---|---|---|---|---|---|---|---|
| Standard | 0.9118 | 0.9193 | 0.9266 | 0.9341 | 0.9414 | 0.9489 | 0.9562 |
| Camarilla | 0.9299 | 0.9313 | 0.9326 | 0.9340 | 0.9354 | 0.9367 | 0.9381 |
| Woodie | 0.9118 | 0.9193 | 0.9266 | 0.9341 | 0.9414 | 0.9489 | 0.9562 |
| Fibonacci | 0.9193 | 0.9249 | 0.9284 | 0.9341 | 0.9397 | 0.9432 | 0.9489 |
| Pivot points | S3 | S2 | S1 | PP | R1 | R2 | R3 |
|---|---|---|---|---|---|---|---|
| Standard | 0.8940 | 0.9103 | 0.9222 | 0.9385 | 0.9504 | 0.9667 | 0.9786 |
| Camarilla | 0.9263 | 0.9288 | 0.9314 | 0.9340 | 0.9366 | 0.9392 | 0.9418 |
| Woodie | 0.8917 | 0.9092 | 0.9199 | 0.9374 | 0.9481 | 0.9656 | 0.9763 |
| Fibonacci | 0.9103 | 0.9211 | 0.9278 | 0.9385 | 0.9493 | 0.9560 | 0.9667 |
Numerical data
The following is the status of technical indicators and moving averages registered at the time this technical analysis was created:
| RSI (14): | 49.32 | |
| MACD (12,26,9): | -0.0010 | |
| Directional Movement: | 6.0643 | |
| AROON (14): | -21.4286 | |
| DEMA (21): | 0.9291 | |
| Parabolic SAR (0,02-0,02-0,2): | 0.9260 | |
| Elder Ray (13): | 0.0010 | |
| Super Trend (3,10): | 0.9346 | |
| Zig ZAG (10): | 0.9310 | |
| VORTEX (21): | 0.9774 | |
| Stochastique (14,3,5): | 76.75 | |
| TEMA (21): | 0.9293 | |
| Williams %R (14): | -27.63 | |
| Chande Momentum Oscillator (20): | 0.0022 | |
| Repulse (5,40,3): | 0.0633 | |
| ROCnROLL: | -1 | |
| TRIX (15,9): | -0.0259 | |
| Courbe Coppock: | 0.32 |
| MA7: | 0.9355 | |
| MA20: | 0.9441 | |
| MA50: | 0.9477 | |
| MA100: | 0.9507 | |
| MAexp7: | 0.9304 | |
| MAexp20: | 0.9308 | |
| MAexp50: | 0.9328 | |
| MAexp100: | 0.9347 | |
| Price / MA7: | -0.18% | |
| Price / MA20: | -1.09% | |
| Price / MA50: | -1.47% | |
| Price / MA100: | -1.78% | |
| Price / MAexp7: | +0.37% | |
| Price / MAexp20: | +0.32% | |
| Price / MAexp50: | +0.11% | |
| Price / MAexp100: | -0.10% |
About author
Online


Add a comment
Comments
0 comments on the analysis CAD/SGD - 1H