CAD/SEK - Daily - Technical analysis published on 04/25/2023 (GMT)
- 157
- 0
Click here for a new analysis!
- Timeframe : Daily
- - Analysis generated on
- Status : INVALID
Summary of the analysis

Additional analysis
Quotes
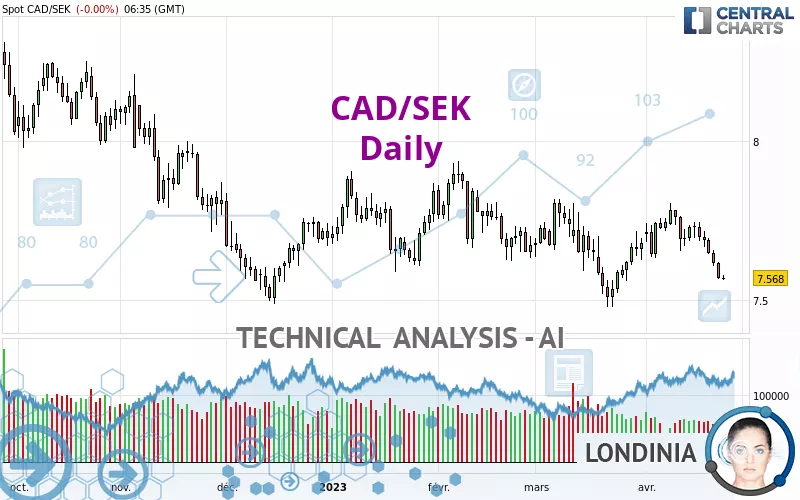
The CAD/SEK price is 7.5680 SEK. The price registered an increase of +0.00% on the session and was traded between 7.5634 SEK and 7.5768 SEK over the period. The price is currently at +0.06% from its lowest and -0.12% from its highest.Here is a more detailed summary of the historical variations registered by CAD/SEK:
Near a new LOW record (1 year)
Type : Bearish
Timeframe : Weekly
Near a new HIGH record (1st january)
Type : Bullish
Timeframe : Weekly
Near a new HIGH record (1 month)
Type : Bullish
Timeframe : Weekly
Technical
Technical analysis of CAD/SEK in Daily shows a overall strongly bearish trend. 89.29% of the signals given by moving averages are bearish. This strongly bearish trend is supported by the strong bearish signals given by short-term moving averages. The Central Indicators market scanner is currently detecting a bearish signal that could impact this trend:
Bearish trend reversal : Moving Average 20
Type : Bearish
Timeframe : Daily
The probability of a further decline is moderate given the direction of the technical indicators.
Caution: the Central Indicators scanner currently detects an excess:
CCI indicator is oversold : under -100
Type : Neutral
Timeframe : Daily
Previous candle closed under Bollinger bands
Type : Neutral
Timeframe : Daily
Williams %R indicator is oversold : under -80
Type : Neutral
Timeframe : Daily
Central Patterns, the market scanner focusing on chart patterns, resistances and supports found these results:
Near horizontal support
Type : Bullish
Timeframe : Daily
Support of channel is broken
Type : Bearish
Timeframe : Daily
The Central Candlesticks scanner which studies Japanese candlesticks did not detect anything.
| S3 | S2 | S1 | Price | R1 | R2 | R3 | |
|---|---|---|---|---|---|---|---|
| ProTrendLines | 6.8178 | 7.1291 | 7.4700 | 7.5680 | 7.6983 | 7.8950 | 8.0718 |
| Change (%) | -9.91% | -5.80% | -1.29% | - | +1.72% | +4.32% | +6.66% |
| Change | -0.7502 | -0.4389 | -0.0980 | - | +0.1303 | +0.3270 | +0.5038 |
| Level | Intermediate | Major | Major | - | Major | Major | Minor |
Attention could also be paid to pivot points to set price objectives:
| Pivot points | S3 | S2 | S1 | PP | R1 | R2 | R3 |
|---|---|---|---|---|---|---|---|
| Standard | 7.4923 | 7.5284 | 7.5482 | 7.5843 | 7.6041 | 7.6402 | 7.6600 |
| Camarilla | 7.5527 | 7.5579 | 7.5630 | 7.5681 | 7.5732 | 7.5784 | 7.5835 |
| Woodie | 7.4843 | 7.5243 | 7.5402 | 7.5802 | 7.5961 | 7.6361 | 7.6520 |
| Fibonacci | 7.5284 | 7.5497 | 7.5629 | 7.5843 | 7.6056 | 7.6188 | 7.6402 |
| Pivot points | S3 | S2 | S1 | PP | R1 | R2 | R3 |
|---|---|---|---|---|---|---|---|
| Standard | 7.4262 | 7.5164 | 7.5657 | 7.6559 | 7.7052 | 7.7954 | 7.8447 |
| Camarilla | 7.5767 | 7.5895 | 7.6023 | 7.6151 | 7.6279 | 7.6407 | 7.6535 |
| Woodie | 7.4059 | 7.5062 | 7.5454 | 7.6457 | 7.6849 | 7.7852 | 7.8244 |
| Fibonacci | 7.5164 | 7.5697 | 7.6026 | 7.6559 | 7.7092 | 7.7421 | 7.7954 |
| Pivot points | S3 | S2 | S1 | PP | R1 | R2 | R3 |
|---|---|---|---|---|---|---|---|
| Standard | 7.1587 | 7.3179 | 7.4986 | 7.6578 | 7.8385 | 7.9977 | 8.1784 |
| Camarilla | 7.5858 | 7.6170 | 7.6481 | 7.6793 | 7.7105 | 7.7416 | 7.7728 |
| Woodie | 7.1695 | 7.3233 | 7.5094 | 7.6632 | 7.8493 | 8.0031 | 8.1892 |
| Fibonacci | 7.3179 | 7.4477 | 7.5280 | 7.6578 | 7.7876 | 7.8679 | 7.9977 |
Numerical data
The following are the details of the technical indicators and moving averages that were collected to generate this technical analysis:
| RSI (14): | 38.54 | |
| MACD (12,26,9): | -0.0178 | |
| Directional Movement: | -13.1664 | |
| AROON (14): | -78.5714 | |
| DEMA (21): | 7.6480 | |
| Parabolic SAR (0,02-0,02-0,2): | 7.7535 | |
| Elder Ray (13): | -0.0846 | |
| Super Trend (3,10): | 7.7446 | |
| Zig ZAG (10): | 7.5737 | |
| VORTEX (21): | 0.9961 | |
| Stochastique (14,3,5): | 3.41 | |
| TEMA (21): | 7.6359 | |
| Williams %R (14): | -95.35 | |
| Chande Momentum Oscillator (20): | -0.1705 | |
| Repulse (5,40,3): | -1.0027 | |
| ROCnROLL: | 2 | |
| TRIX (15,9): | 0.0013 | |
| Courbe Coppock: | 1.50 |
| MA7: | 7.6456 | |
| MA20: | 7.6879 | |
| MA50: | 7.6810 | |
| MA100: | 7.7006 | |
| MAexp7: | 7.6285 | |
| MAexp20: | 7.6650 | |
| MAexp50: | 7.6875 | |
| MAexp100: | 7.7301 | |
| Price / MA7: | -1.01% | |
| Price / MA20: | -1.56% | |
| Price / MA50: | -1.47% | |
| Price / MA100: | -1.72% | |
| Price / MAexp7: | -0.79% | |
| Price / MAexp20: | -1.27% | |
| Price / MAexp50: | -1.55% | |
| Price / MAexp100: | -2.10% |
About author
Online


Add a comment
Comments
0 comments on the analysis CAD/SEK - Daily