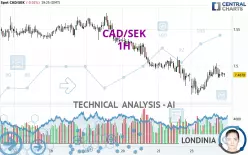
CAD/SEK - 1H - Technical analysis published on 02/24/2025 (GMT)
- 92
- 0
Click here for a new analysis!
- Timeframe : 1H
- - Analysis generated on
- Status : TARGET REACHED

Summary of the analysis

Additional analysis
Quotes
The CAD/SEK price is 7.4878 SEK. The price registered a decrease of -0.01% on the session and was between 7.4600 SEK and 7.5034 SEK. This implies that the price is at +0.37% from its lowest and at -0.21% from its highest.The Central Gaps scanner detects a bearish gap which is a sign that the sellers have taken the lead in the very short term.
Opening Gap DOWN
Type : Bearish
Timeframe : Openning
A study of price movements over other periods shows the following variations:
Near a new LOW record (1 year)
Type : Bearish
Timeframe : Weekly
Near a new HIGH record (1st january)
Type : Bullish
Timeframe : Weekly
New LOW record (1st january)
Type : Bearish
Timeframe : Weekly
Near a new HIGH record (1 month)
Type : Bullish
Timeframe : Weekly
New LOW record (1 month)
Type : Bearish
Timeframe : Weekly
Technical
A technical analysis in 1H of this CAD/SEK chart shows a bearish trend. 71.43% of the signals given by moving averages are bearish. Caution: the neutral signals currently given by short-term moving averages show us that the global trend is losing momentum. The Central Indicators market scanner currently does not detect any result that concerns moving averages.
In fact, Central Analyzer took into account 18 technical indicators and the result was as follows: 8 are bullish, 6 are neutral and 4 are bearish. Other results related to technical indicators were also found by the Central Indicators scanner:
RSI indicator is back under 50
Type : Bearish
Timeframe : 1 hour
Parabolic SAR indicator bearish reversal
Type : Bearish
Timeframe : 1 hour
The Central Patterns scanner, which studies chart patterns, resistances and supports, has identified these signals:
Near horizontal resistance
Type : Bearish
Timeframe : 1 hour
Resistance of channel is broken
Type : Bullish
Timeframe : 1 hour
No result was found by the Central Candlesticks scanner on Japanese candlesticks.
| S3 | S2 | S1 | Price | R1 | R2 | R3 | |
|---|---|---|---|---|---|---|---|
| ProTrendLines | 6.9606 | 7.1291 | 7.4685 | 7.4878 | 7.4949 | 7.5341 | 7.5722 |
| Change (%) | -7.04% | -4.79% | -0.26% | - | +0.09% | +0.62% | +1.13% |
| Change | -0.5272 | -0.3587 | -0.0193 | - | +0.0071 | +0.0463 | +0.0844 |
| Level | Minor | Major | Major | - | Intermediate | Intermediate | Minor |
Pivot points can also be used to set your price objectives. Here is the price situation in relation to pivot points:
| Pivot points | S3 | S2 | S1 | PP | R1 | R2 | R3 |
|---|---|---|---|---|---|---|---|
| Standard | 7.4299 | 7.4512 | 7.4697 | 7.4910 | 7.5095 | 7.5308 | 7.5493 |
| Camarilla | 7.4774 | 7.4810 | 7.4847 | 7.4883 | 7.4920 | 7.4956 | 7.4993 |
| Woodie | 7.4286 | 7.4505 | 7.4684 | 7.4903 | 7.5082 | 7.5301 | 7.5480 |
| Fibonacci | 7.4512 | 7.4664 | 7.4758 | 7.4910 | 7.5062 | 7.5156 | 7.5308 |
| Pivot points | S3 | S2 | S1 | PP | R1 | R2 | R3 |
|---|---|---|---|---|---|---|---|
| Standard | 7.3502 | 7.4113 | 7.4498 | 7.5109 | 7.5494 | 7.6105 | 7.6490 |
| Camarilla | 7.4609 | 7.4700 | 7.4792 | 7.4883 | 7.4974 | 7.5066 | 7.5157 |
| Woodie | 7.3389 | 7.4057 | 7.4385 | 7.5053 | 7.5381 | 7.6049 | 7.6377 |
| Fibonacci | 7.4113 | 7.4494 | 7.4729 | 7.5109 | 7.5490 | 7.5725 | 7.6105 |
| Pivot points | S3 | S2 | S1 | PP | R1 | R2 | R3 |
|---|---|---|---|---|---|---|---|
| Standard | 7.2368 | 7.4025 | 7.5163 | 7.6820 | 7.7958 | 7.9615 | 8.0753 |
| Camarilla | 7.5531 | 7.5788 | 7.6044 | 7.6300 | 7.6556 | 7.6812 | 7.7069 |
| Woodie | 7.2108 | 7.3895 | 7.4903 | 7.6690 | 7.7698 | 7.9485 | 8.0493 |
| Fibonacci | 7.4025 | 7.5093 | 7.5753 | 7.6820 | 7.7888 | 7.8548 | 7.9615 |
Numerical data
The following are the details of the technical indicators and moving averages that were collected to generate this technical analysis:
| RSI (14): | 51.02 | |
| MACD (12,26,9): | 0.0005 | |
| Directional Movement: | 0.1527 | |
| AROON (14): | 64.2857 | |
| DEMA (21): | 7.4859 | |
| Parabolic SAR (0,02-0,02-0,2): | 7.4850 | |
| Elder Ray (13): | 0.0013 | |
| Super Trend (3,10): | 7.5050 | |
| Zig ZAG (10): | 7.4872 | |
| VORTEX (21): | 1.1031 | |
| Stochastique (14,3,5): | 58.13 | |
| TEMA (21): | 7.4907 | |
| Williams %R (14): | -47.65 | |
| Chande Momentum Oscillator (20): | 0.0058 | |
| Repulse (5,40,3): | -0.1006 | |
| ROCnROLL: | 2 | |
| TRIX (15,9): | -0.0018 | |
| Courbe Coppock: | 0.44 |
| MA7: | 7.5208 | |
| MA20: | 7.5905 | |
| MA50: | 7.6580 | |
| MA100: | 7.6886 | |
| MAexp7: | 7.4882 | |
| MAexp20: | 7.4865 | |
| MAexp50: | 7.4934 | |
| MAexp100: | 7.5099 | |
| Price / MA7: | -0.44% | |
| Price / MA20: | -1.35% | |
| Price / MA50: | -2.22% | |
| Price / MA100: | -2.61% | |
| Price / MAexp7: | -0.01% | |
| Price / MAexp20: | +0.02% | |
| Price / MAexp50: | -0.07% | |
| Price / MAexp100: | -0.29% |
About author
Online


Add a comment
Comments
0 comments on the analysis CAD/SEK - 1H