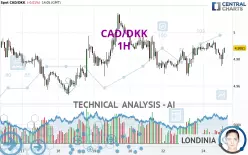
CAD/DKK - 1H - Technical analysis published on 12/24/2024 (GMT)
- 95
- 0
Click here for a new analysis!
- Timeframe : 1H
- - Analysis generated on
- Status : TARGET REACHED

Summary of the analysis

Additional analysis
Quotes
The CAD/DKK rating is 4.9881 DKK. The price is lower by -0.01% since the last closing and was traded between 4.9748 DKK and 4.9937 DKK over the period. The price is currently at +0.27% from its lowest and -0.11% from its highest.A study of price movements over other periods shows the following variations:
Near a new HIGH record (1 year)
Type : Bullish
Timeframe : Weekly
New HIGH record (1st january)
Type : Bullish
Timeframe : Weekly
Near a new HIGH record (1 month)
Type : Bullish
Timeframe : Weekly
Technical
Technical analysis of CAD/DKK in 1H shows an overall bullish trend. 75.00% of the signals given by moving averages are bullish. This bullish trend shows slight signs of slowing down given the slightly bullish signals given by the short-term moving averages. The Central Indicators market scanner is currently detecting several bullish signals that could impact this trend:
Bullish price crossover with Moving Average 50
Type : Bullish
Timeframe : 1 hour
Bullish price crossover with Moving Average 100
Type : Bullish
Timeframe : 1 hour
Bullish price crossover with adaptative moving average 20
Type : Bullish
Timeframe : 1 hour
Bullish price crossover with adaptative moving average 50
Type : Bullish
Timeframe : 1 hour
In fact, only 7 technical indicators out of 18 studied are currently bullish. Caution: the Central Indicators scanner currently detects an excess:
CCI indicator is oversold : under -100
Type : Neutral
Timeframe : 1 hour
Previous candle closed under Bollinger bands
Type : Neutral
Timeframe : 1 hour
RSI indicator is back over 50
Type : Bullish
Timeframe : 1 hour
Price is back over the pivot point
Type : Bullish
Timeframe : 1 hour
Price is back over the pivot point
Type : Bullish
Timeframe : Weekly
Williams %R indicator is back over -50
Type : Bullish
Timeframe : 1 hour
An analysis of the price chart with the Central Patterns scanner (detector of chart patterns and resistances and supports) shows several results that can have an impact on the price change:
Near resistance of channel
Type : Bearish
Timeframe : 1 hour
Near resistance of triangle
Type : Bearish
Timeframe : 1 hour
The Central Candlesticks scanner, specialised in Japanese candlesticks, did not identify any signals.
| S3 | S2 | S1 | Price | R1 | R2 | R3 | |
|---|---|---|---|---|---|---|---|
| ProTrendLines | 4.9530 | 4.9676 | 4.9844 | 4.9881 | 4.9902 | 5.0011 | 5.0107 |
| Change (%) | -0.70% | -0.41% | -0.07% | - | +0.04% | +0.26% | +0.45% |
| Change | -0.0351 | -0.0205 | -0.0037 | - | +0.0021 | +0.0130 | +0.0226 |
| Level | Minor | Intermediate | Intermediate | - | Minor | Intermediate | Major |
Attention could also be paid to pivot points to set price objectives:
| Pivot points | S3 | S2 | S1 | PP | R1 | R2 | R3 |
|---|---|---|---|---|---|---|---|
| Standard | 4.9495 | 4.9582 | 4.9734 | 4.9821 | 4.9973 | 5.0060 | 5.0212 |
| Camarilla | 4.9819 | 4.9841 | 4.9863 | 4.9885 | 4.9907 | 4.9929 | 4.9951 |
| Woodie | 4.9527 | 4.9598 | 4.9766 | 4.9837 | 5.0005 | 5.0076 | 5.0244 |
| Fibonacci | 4.9582 | 4.9674 | 4.9730 | 4.9821 | 4.9913 | 4.9969 | 5.0060 |
| Pivot points | S3 | S2 | S1 | PP | R1 | R2 | R3 |
|---|---|---|---|---|---|---|---|
| Standard | 4.8849 | 4.9189 | 4.9462 | 4.9802 | 5.0075 | 5.0415 | 5.0688 |
| Camarilla | 4.9565 | 4.9622 | 4.9678 | 4.9734 | 4.9790 | 4.9846 | 4.9903 |
| Woodie | 4.8815 | 4.9172 | 4.9428 | 4.9785 | 5.0041 | 5.0398 | 5.0654 |
| Fibonacci | 4.9189 | 4.9424 | 4.9568 | 4.9802 | 5.0037 | 5.0181 | 5.0415 |
| Pivot points | S3 | S2 | S1 | PP | R1 | R2 | R3 |
|---|---|---|---|---|---|---|---|
| Standard | 4.6857 | 4.8007 | 4.9181 | 5.0331 | 5.1505 | 5.2655 | 5.3829 |
| Camarilla | 4.9717 | 4.9930 | 5.0143 | 5.0356 | 5.0569 | 5.0782 | 5.0995 |
| Woodie | 4.6870 | 4.8013 | 4.9194 | 5.0337 | 5.1518 | 5.2661 | 5.3842 |
| Fibonacci | 4.8007 | 4.8894 | 4.9443 | 5.0331 | 5.1218 | 5.1767 | 5.2655 |
Numerical data
The following are the details of the technical indicators and moving averages that were collected to generate this technical analysis:
| RSI (14): | 49.95 | |
| MACD (12,26,9): | 0.0004 | |
| Directional Movement: | -5.0321 | |
| AROON (14): | -35.7142 | |
| DEMA (21): | 4.9865 | |
| Parabolic SAR (0,02-0,02-0,2): | 4.9927 | |
| Elder Ray (13): | -0.0041 | |
| Super Trend (3,10): | 4.9788 | |
| Zig ZAG (10): | 4.9847 | |
| VORTEX (21): | 1.0167 | |
| Stochastique (14,3,5): | 34.67 | |
| TEMA (21): | 4.9863 | |
| Williams %R (14): | -45.50 | |
| Chande Momentum Oscillator (20): | -0.0027 | |
| Repulse (5,40,3): | 0.1071 | |
| ROCnROLL: | -1 | |
| TRIX (15,9): | 0.0046 | |
| Courbe Coppock: | 0.06 |
| MA7: | 4.9824 | |
| MA20: | 5.0068 | |
| MA50: | 5.0041 | |
| MA100: | 4.9837 | |
| MAexp7: | 4.9848 | |
| MAexp20: | 4.9857 | |
| MAexp50: | 4.9846 | |
| MAexp100: | 4.9844 | |
| Price / MA7: | +0.11% | |
| Price / MA20: | -0.37% | |
| Price / MA50: | -0.32% | |
| Price / MA100: | +0.09% | |
| Price / MAexp7: | +0.07% | |
| Price / MAexp20: | +0.05% | |
| Price / MAexp50: | +0.07% | |
| Price / MAexp100: | +0.07% |
About author
Online


Add a comment
Comments
0 comments on the analysis CAD/DKK - 1H