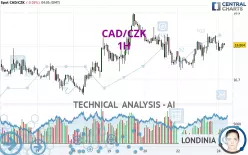
CAD/CZK - 1H - Technical analysis published on 12/24/2024 (GMT)
- 83
- 0
Click here for a new analysis!
- Timeframe : 1H
- - Analysis generated on
- Status : TARGET REACHED

Summary of the analysis

Additional analysis
Quotes
CAD/CZK rating 16.804 CZK. The price is lower by -0.03% since the last closing and was traded between 16.785 CZK and 16.817 CZK over the period. The price is currently at +0.11% from its lowest and -0.08% from its highest.So that you have an overall view of the price change, here is a table showing the variations over several periods:
Near a new HIGH record (1 year)
Type : Bullish
Timeframe : Weekly
Near a new HIGH record (1 month)
Type : Bullish
Timeframe : Weekly
Technical
A technical analysis in 1H of this CAD/CZK chart shows a strongly bullish trend. 85.71% of the signals given by moving averages are bullish. The overall trend is supported by the strong bullish signals from short-term moving averages. The Central Indicators market scanner is currently detecting a bullish signal that could impact this trend:
Bullish price crossover with Moving Average 20
Type : Bullish
Timeframe : 1 hour
In fact, only 7 technical indicators out of 18 studied are currently bullish. Central Indicators, the detector scanner for these technical indicators has recently detected several signals:
RSI indicator is back over 50
Type : Bullish
Timeframe : 1 hour
Williams %R indicator is back over -50
Type : Bullish
Timeframe : 1 hour
The Central Patterns scanner, which studies chart patterns, resistances and supports, has identified these signals:
Near resistance of triangle
Type : Bearish
Timeframe : 1 hour
Near support of channel
Type : Bullish
Timeframe : 1 hour
Central Candlesticks, the scanner specialised in Japanese candlesticks, detects this inversion signal that could impact the current short-term trend:
Doji
Type : Neutral
Timeframe : 1 hour
| S3 | S2 | S1 | Price | R1 | R2 | R3 | |
|---|---|---|---|---|---|---|---|
| ProTrendLines | 16.757 | 16.777 | 16.798 | 16.804 | 16.838 | 16.857 | 16.898 |
| Change (%) | -0.28% | -0.16% | -0.04% | - | +0.20% | +0.32% | +0.56% |
| Change | -0.047 | -0.027 | -0.006 | - | +0.034 | +0.053 | +0.094 |
| Level | Minor | Minor | Intermediate | - | Intermediate | Minor | Intermediate |
Pivot points can also be used to set your price objectives. Here is the price situation in relation to pivot points:
| Pivot points | S3 | S2 | S1 | PP | R1 | R2 | R3 |
|---|---|---|---|---|---|---|---|
| Standard | 16.637 | 16.683 | 16.746 | 16.792 | 16.855 | 16.901 | 16.964 |
| Camarilla | 16.779 | 16.789 | 16.799 | 16.809 | 16.819 | 16.829 | 16.839 |
| Woodie | 16.646 | 16.687 | 16.755 | 16.796 | 16.864 | 16.905 | 16.973 |
| Fibonacci | 16.683 | 16.725 | 16.750 | 16.792 | 16.834 | 16.859 | 16.901 |
| Pivot points | S3 | S2 | S1 | PP | R1 | R2 | R3 |
|---|---|---|---|---|---|---|---|
| Standard | 16.404 | 16.529 | 16.649 | 16.774 | 16.894 | 17.019 | 17.139 |
| Camarilla | 16.702 | 16.724 | 16.747 | 16.769 | 16.792 | 16.814 | 16.836 |
| Woodie | 16.402 | 16.528 | 16.647 | 16.773 | 16.892 | 17.018 | 17.137 |
| Fibonacci | 16.529 | 16.623 | 16.680 | 16.774 | 16.868 | 16.925 | 17.019 |
| Pivot points | S3 | S2 | S1 | PP | R1 | R2 | R3 |
|---|---|---|---|---|---|---|---|
| Standard | 15.765 | 16.215 | 16.640 | 17.090 | 17.515 | 17.965 | 18.390 |
| Camarilla | 16.825 | 16.906 | 16.986 | 17.066 | 17.146 | 17.226 | 17.307 |
| Woodie | 15.754 | 16.209 | 16.629 | 17.084 | 17.504 | 17.959 | 18.379 |
| Fibonacci | 16.215 | 16.549 | 16.755 | 17.090 | 17.424 | 17.630 | 17.965 |
Numerical data
The following is the status of technical indicators and moving averages registered at the time this technical analysis was created:
| RSI (14): | 52.67 | |
| MACD (12,26,9): | 0.0050 | |
| Directional Movement: | 2.964 | |
| AROON (14): | 21.428 | |
| DEMA (21): | 16.805 | |
| Parabolic SAR (0,02-0,02-0,2): | 16.831 | |
| Elder Ray (13): | -0.003 | |
| Super Trend (3,10): | 16.747 | |
| Zig ZAG (10): | 16.806 | |
| VORTEX (21): | 1.0900 | |
| Stochastique (14,3,5): | 52.92 | |
| TEMA (21): | 16.810 | |
| Williams %R (14): | -37.50 | |
| Chande Momentum Oscillator (20): | 0.012 | |
| Repulse (5,40,3): | 0.0650 | |
| ROCnROLL: | 1 | |
| TRIX (15,9): | 0.0060 | |
| Courbe Coppock: | 0.19 |
| MA7: | 16.777 | |
| MA20: | 16.875 | |
| MA50: | 16.931 | |
| MA100: | 16.834 | |
| MAexp7: | 16.803 | |
| MAexp20: | 16.798 | |
| MAexp50: | 16.792 | |
| MAexp100: | 16.785 | |
| Price / MA7: | +0.16% | |
| Price / MA20: | -0.42% | |
| Price / MA50: | -0.75% | |
| Price / MA100: | -0.18% | |
| Price / MAexp7: | +0.01% | |
| Price / MAexp20: | +0.04% | |
| Price / MAexp50: | +0.07% | |
| Price / MAexp100: | +0.11% |
About author
Online


Add a comment
Comments
0 comments on the analysis CAD/CZK - 1H