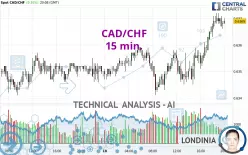
CAD/CHF - 15 min. - Technical analysis published on 02/18/2025 (GMT)
- 147
- 0
Click here for a new analysis!
- Timeframe : 15 min.
- - Analysis generated on
- Status : LEVEL MAINTAINED

Summary of the analysis

Additional analysis
Quotes
The CAD/CHF rating is 0.6369 CHF. The price registered an increase of +0.30% on the session with the lowest point at 0.6341 CHF and the highest point at 0.6372 CHF. The deviation from the price is +0.44% for the low point and -0.05% for the high point.A study of price movements over other periods shows the following variations:
Near a new LOW record (5 years)
Type : Bearish
Timeframe : Weekly
Near a new LOW record (1 year)
Type : Bearish
Timeframe : Weekly
Near a new LOW record (1st january)
Type : Bearish
Timeframe : Weekly
Near a new LOW record (1 month)
Type : Bearish
Timeframe : Weekly
Technical
A technical analysis in 15 min. of this CAD/CHF chart shows a strongly bullish trend. 92.86% of the signals given by moving averages are bullish. The overall trend is supported by the strong bullish signals from short-term moving averages. The Central Indicators market scanner currently does not detect any result that concerns moving averages.
The probability of a further increase are moderate given the direction of the technical indicators.
But beware of excesses. The Central Indicators scanner currently detects this:
Williams %R indicator is overbought : over -20
Type : Neutral
Timeframe : 15 minutes
Pivot points : price is over resistance 1
Type : Neutral
Timeframe : 15 minutes
Price is back over the pivot point
Type : Bullish
Timeframe : Weekly
Central Patterns, the market scanner focusing on chart patterns, resistances and supports found this result:
Near resistance of channel
Type : Bearish
Timeframe : 15 minutes
The Central Candlesticks scanner which studies Japanese candlesticks did not detect anything.
| S3 | S2 | S1 | Price | R1 | R2 | R3 | |
|---|---|---|---|---|---|---|---|
| ProTrendLines | 0.6324 | 0.6342 | 0.6357 | 0.6369 | 0.6374 | 0.6395 | 0.6482 |
| Change (%) | -0.71% | -0.42% | -0.19% | - | +0.08% | +0.41% | +1.77% |
| Change | -0.0045 | -0.0027 | -0.0012 | - | +0.0005 | +0.0026 | +0.0113 |
| Level | Major | Major | Major | - | Minor | Major | Major |
To determine price objectives, it is also possible to use the pivot points. Here is the price position in relation to pivot points:
| Pivot points | S3 | S2 | S1 | PP | R1 | R2 | R3 |
|---|---|---|---|---|---|---|---|
| Standard | 0.6306 | 0.6317 | 0.6334 | 0.6345 | 0.6362 | 0.6373 | 0.6390 |
| Camarilla | 0.6342 | 0.6345 | 0.6347 | 0.6350 | 0.6353 | 0.6355 | 0.6358 |
| Woodie | 0.6308 | 0.6319 | 0.6336 | 0.6347 | 0.6364 | 0.6375 | 0.6392 |
| Fibonacci | 0.6317 | 0.6328 | 0.6335 | 0.6345 | 0.6356 | 0.6363 | 0.6373 |
| Pivot points | S3 | S2 | S1 | PP | R1 | R2 | R3 |
|---|---|---|---|---|---|---|---|
| Standard | 0.6247 | 0.6289 | 0.6315 | 0.6357 | 0.6383 | 0.6425 | 0.6451 |
| Camarilla | 0.6323 | 0.6330 | 0.6336 | 0.6342 | 0.6348 | 0.6355 | 0.6361 |
| Woodie | 0.6240 | 0.6285 | 0.6308 | 0.6353 | 0.6376 | 0.6421 | 0.6444 |
| Fibonacci | 0.6289 | 0.6315 | 0.6331 | 0.6357 | 0.6383 | 0.6399 | 0.6425 |
| Pivot points | S3 | S2 | S1 | PP | R1 | R2 | R3 |
|---|---|---|---|---|---|---|---|
| Standard | 0.6054 | 0.6145 | 0.6205 | 0.6296 | 0.6356 | 0.6447 | 0.6507 |
| Camarilla | 0.6225 | 0.6238 | 0.6252 | 0.6266 | 0.6280 | 0.6294 | 0.6308 |
| Woodie | 0.6040 | 0.6137 | 0.6191 | 0.6288 | 0.6342 | 0.6439 | 0.6493 |
| Fibonacci | 0.6145 | 0.6202 | 0.6238 | 0.6296 | 0.6353 | 0.6389 | 0.6447 |
Numerical data
The following are the details of the technical indicators and moving averages that were collected to generate this technical analysis:
| RSI (14): | 60.91 | |
| MACD (12,26,9): | 0.0005 | |
| Directional Movement: | 13.2713 | |
| AROON (14): | 78.5714 | |
| DEMA (21): | 0.6369 | |
| Parabolic SAR (0,02-0,02-0,2): | 0.6366 | |
| Elder Ray (13): | 0.0002 | |
| Super Trend (3,10): | 0.6357 | |
| Zig ZAG (10): | 0.6368 | |
| VORTEX (21): | 1.1633 | |
| Stochastique (14,3,5): | 85.32 | |
| TEMA (21): | 0.6372 | |
| Williams %R (14): | -25.00 | |
| Chande Momentum Oscillator (20): | 0.0010 | |
| Repulse (5,40,3): | -0.0023 | |
| ROCnROLL: | 1 | |
| TRIX (15,9): | 0.0096 | |
| Courbe Coppock: | 0.44 |
| MA7: | 0.6366 | |
| MA20: | 0.6325 | |
| MA50: | 0.6305 | |
| MA100: | 0.6292 | |
| MAexp7: | 0.6368 | |
| MAexp20: | 0.6363 | |
| MAexp50: | 0.6358 | |
| MAexp100: | 0.6355 | |
| Price / MA7: | +0.05% | |
| Price / MA20: | +0.70% | |
| Price / MA50: | +1.02% | |
| Price / MA100: | +1.22% | |
| Price / MAexp7: | +0.02% | |
| Price / MAexp20: | +0.09% | |
| Price / MAexp50: | +0.17% | |
| Price / MAexp100: | +0.22% |
News
Don't forget to follow the news on CAD/CHF. At the time of publication of this analysis, the latest news was as follows:
-
 CAD/CHF Analysis: Can the Loonie Break Out?
-
CAD/CHF Analysis: Can the Loonie Break Above Resistance?
-
CAD/CHF Forecast - Can the CAD Smash the Franc?
-
CAD/CHF Forecast November 27, 2024
-
CAD/CHF Forecast November 12, 2024
About author

Online


Add a comment
Comments
0 comments on the analysis CAD/CHF - 15 min.