| Open: | 82,372.94 |
| Change: | -251.87 |
| Volume: | 34,167 |
| Low: | 81,283.19 |
| High: | 82,443.37 |
| High / Low range: | 1,160.18 |
| Type: | Cryptocurrencies |
| Ticker: | BTCUSD |
| ISIN: |
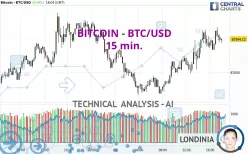
BITCOIN - BTC/USD - 15 min. - Technical analysis published on 03/25/2025 (GMT)
- 123
- 0
- 03/25/2025 - 18:04
Click here for a new analysis!
- Timeframe : 15 min.
- - Analysis generated on 03/25/2025 - 18:04
- Status : LEVEL MAINTAINED

Summary of the analysis

Additional analysis
Quotes
BITCOIN - BTC/USD rating 87,994.12 USD. The price has increased by +0.54% since the last closing and was traded between 86,334.20 USD and 88,350.58 USD over the period. The price is currently at +1.92% from its lowest and -0.40% from its highest.The Central Gaps scanner detects a bullish opening. A small advantage for buyers in the very short term.
Bullish opening
Type : Bullish
Timeframe : Openning
A study of price movements over other periods shows the following variations:
Technical
Technical analysis of BITCOIN - BTC/USD in 15 min. shows an overall bullish trend. 78.57% of the signals given by moving averages are bullish. The overall trend is reinforced by the strong bullish signals from short-term moving averages. The Central Indicators market scanner is currently detecting several bearish and bullish signals that could impact this trend:
Bullish trend reversal : Moving Average 100
Type : Bullish
Timeframe : 15 minutes
Bearish trend reversal : Moving Average 100
Type : Bearish
Timeframe : 15 minutes
The probability of a further increase is slight given the direction of the technical indicators.
Caution: the Central Indicators scanner currently detects an excess:
CCI indicator is overbought : over 100
Type : Neutral
Timeframe : 15 minutes
Pivot points : price is over resistance 1 (Daily)
Type : Neutral
Timeframe : Weekly
Pivot points : price is over resistance 1 (Weekly)
Type : Neutral
Timeframe : 15 minutes
Pivot points : price is over resistance 1 (Monthly)
Type : Neutral
Timeframe : 15 minutes
An analysis of the price chart with the Central Patterns scanner (detector of chart patterns and resistances and supports) shows a result that can have an impact on the price change:
Resistance of channel is broken
Type : Bullish
Timeframe : 15 minutes
For a small setback in the very short term, the Central Candlesticks scanner currently notes the presence of this bearish pattern in Japanese candlesticks:
Bearish engulfing lines
Type : Bearish
Timeframe : 15 minutes
| S3 | S2 | S1 | Price | R1 | R2 | R3 | |
|---|---|---|---|---|---|---|---|
| ProTrendLines | 82,463.68 | 84,762.21 | 86,925.18 | 87,994.12 | 88,777.70 | 92,549.70 | 99,125.21 |
| Change (%) | -6.29% | -3.67% | -1.21% | - | +0.89% | +5.18% | +12.65% |
| Change | -5,530.44 | -3,231.91 | -1,068.94 | - | +783.58 | +4,555.58 | +11,131.09 |
| Level | Minor | Major | Major | - | Intermediate | Intermediate | Minor |
Pivot points can also be used to set your price objectives. Here is the price situation in relation to pivot points:
| Pivot points | S3 | S2 | S1 | PP | R1 | R2 | R3 |
|---|---|---|---|---|---|---|---|
| Standard | 82,554.56 | 84,050.73 | 85,785.37 | 87,281.54 | 89,016.18 | 90,512.35 | 92,246.99 |
| Camarilla | 86,631.55 | 86,927.71 | 87,223.86 | 87,520.02 | 87,816.18 | 88,112.34 | 88,408.49 |
| Woodie | 82,673.81 | 84,110.35 | 85,904.62 | 87,341.16 | 89,135.43 | 90,571.97 | 92,366.24 |
| Fibonacci | 84,050.73 | 85,284.90 | 86,047.37 | 87,281.54 | 88,515.71 | 89,278.18 | 90,512.35 |
| Pivot points | S3 | S2 | S1 | PP | R1 | R2 | R3 |
|---|---|---|---|---|---|---|---|
| Standard | 74,512.03 | 77,826.22 | 80,831.34 | 84,145.53 | 87,150.65 | 90,464.84 | 93,469.96 |
| Camarilla | 82,098.64 | 82,677.91 | 83,257.18 | 83,836.45 | 84,415.72 | 84,994.99 | 85,574.26 |
| Woodie | 74,357.49 | 77,748.95 | 80,676.80 | 84,068.26 | 86,996.11 | 90,387.57 | 93,315.42 |
| Fibonacci | 77,826.22 | 80,240.20 | 81,731.56 | 84,145.53 | 86,559.51 | 88,050.87 | 90,464.84 |
| Pivot points | S3 | S2 | S1 | PP | R1 | R2 | R3 |
|---|---|---|---|---|---|---|---|
| Standard | 50,875.95 | 64,551.26 | 74,438.36 | 88,113.67 | 98,000.77 | 111,676.08 | 121,563.18 |
| Camarilla | 77,845.81 | 80,005.70 | 82,165.58 | 84,325.47 | 86,485.36 | 88,645.25 | 90,805.13 |
| Woodie | 48,981.86 | 63,604.21 | 72,544.27 | 87,166.62 | 96,106.68 | 110,729.03 | 119,669.09 |
| Fibonacci | 64,551.26 | 73,552.10 | 79,112.83 | 88,113.67 | 97,114.51 | 102,675.24 | 111,676.08 |
Numerical data
The following is the status of the technical indicators and moving averages at the time of publication of this technical analysis:
| RSI (14): | 54.31 | |
| MACD (12,26,9): | 212.3400 | |
| Directional Movement: | 6.42 | |
| AROON (14): | 35.71 | |
| DEMA (21): | 87,975.15 | |
| Parabolic SAR (0,02-0,02-0,2): | 88,281.82 | |
| Elder Ray (13): | -52.30 | |
| Super Trend (3,10): | 87,128.68 | |
| Zig ZAG (10): | 87,786.70 | |
| VORTEX (21): | 1.0600 | |
| Stochastique (14,3,5): | 61.76 | |
| TEMA (21): | 88,039.79 | |
| Williams %R (14): | -33.68 | |
| Chande Momentum Oscillator (20): | 265.73 | |
| Repulse (5,40,3): | 0.2100 | |
| ROCnROLL: | 1 | |
| TRIX (15,9): | 0.0400 | |
| Courbe Coppock: | 1.12 |
| MA7: | 85,800.58 | |
| MA20: | 84,389.59 | |
| MA50: | 90,005.72 | |
| MA100: | 94,573.54 | |
| MAexp7: | 87,898.93 | |
| MAexp20: | 87,682.40 | |
| MAexp50: | 87,412.89 | |
| MAexp100: | 87,244.85 | |
| Price / MA7: | +2.56% | |
| Price / MA20: | +4.27% | |
| Price / MA50: | -2.23% | |
| Price / MA100: | -6.96% | |
| Price / MAexp7: | +0.11% | |
| Price / MAexp20: | +0.36% | |
| Price / MAexp50: | +0.66% | |
| Price / MAexp100: | +0.86% |
About author

Online


Add a comment
Comments
0 comments on the analysis BITCOIN - BTC/USD - 15 min.