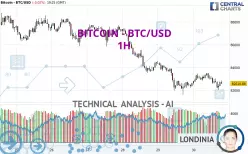
BITCOIN - BTC/USD - 1H - Technical analysis published on 03/30/2025 (GMT)
- 157
- 0
Click here for a new analysis!
- Timeframe : 1H
- - Analysis generated on
- Status : LEVEL MAINTAINED

Summary of the analysis

Additional analysis
Quotes
The BITCOIN - BTC/USD price is 82,610.04 USD. The price registered a decrease of -0.02% on the session and was traded between 82,041.97 USD and 83,516.44 USD over the period. The price is currently at +0.69% from its lowest and -1.09% from its highest.A bullish opening was detected by the Central Gaps scanner. Buyers are trying to impose a bullish momentum in the very short term.
Bullish opening
Type : Bullish
Timeframe : Openning
So that you have an overall view of the price change, here is a table showing the variations over several periods:
Technical
Technical analysis of BITCOIN - BTC/USD in 1H shows a overall strongly bearish trend. The signals given by moving averages are 89.29% bearish. This strongly bearish trend seems to be slowing down given the slightly bearish signals being given by short-term moving averages. The Central Indicators market scanner is currently detecting a bullish signal that could impact this trend:
Bullish trend reversal : Moving Average 20
Type : Bullish
Timeframe : 1 hour
An assessment of technical indicators shows a slightly bearish signal.
Other results related to technical indicators were also found by the Central Indicators scanner:
Pivot points : price is under support 3 (Daily)
Type : Neutral
Timeframe : 1 hour
MACD crosses UP its Moving Average
Type : Bullish
Timeframe : 1 hour
Parabolic SAR indicator bullish reversal
Type : Bullish
Timeframe : 1 hour
Price is back over the pivot point (Daily)
Type : Bullish
Timeframe : Weekly
Central Patterns, the scanner specializing in chart patterns, did not identify any signals.
The presence of a bearish pattern in Japanese candlesticks detected by Central Candlesticks that could cause a correction in the very short term was also detected:
Bearish doji star
Type : Bearish
Timeframe : 1 hour
| S3 | S2 | S1 | Price | R1 | R2 | R3 | |
|---|---|---|---|---|---|---|---|
| ProTrendLines | 67,552.80 | 72,723.43 | 78,573.48 | 82,610.04 | 83,144.65 | 83,673.76 | 84,524.55 |
| Change (%) | -18.23% | -11.97% | -4.89% | - | +0.65% | +1.29% | +2.32% |
| Change | -15,057.24 | -9,886.61 | -4,036.56 | - | +534.61 | +1,063.72 | +1,914.51 |
| Level | Major | Minor | Intermediate | - | Minor | Intermediate | Minor |
Pivot points can also be used to set your price objectives. Here is the price situation in relation to pivot points:
| Pivot points | S3 | S2 | S1 | PP | R1 | R2 | R3 |
|---|---|---|---|---|---|---|---|
| Standard | 78,373.35 | 80,004.72 | 81,315.07 | 82,946.44 | 84,256.79 | 85,888.16 | 87,198.51 |
| Camarilla | 81,816.45 | 82,086.11 | 82,355.76 | 82,625.42 | 82,895.08 | 83,164.74 | 83,434.39 |
| Woodie | 78,212.84 | 79,924.47 | 81,154.56 | 82,866.19 | 84,096.28 | 85,807.91 | 87,038.00 |
| Fibonacci | 80,004.72 | 81,128.46 | 81,822.70 | 82,946.44 | 84,070.18 | 84,764.42 | 85,888.16 |
| Pivot points | S3 | S2 | S1 | PP | R1 | R2 | R3 |
|---|---|---|---|---|---|---|---|
| Standard | 72,773.50 | 77,204.79 | 79,915.11 | 84,346.40 | 87,056.72 | 91,488.01 | 94,198.33 |
| Camarilla | 80,661.48 | 81,316.13 | 81,970.77 | 82,625.42 | 83,280.07 | 83,934.72 | 84,589.36 |
| Woodie | 71,913.01 | 76,774.55 | 79,054.62 | 83,916.16 | 86,196.23 | 91,057.77 | 93,337.84 |
| Fibonacci | 77,204.79 | 79,932.89 | 81,618.31 | 84,346.40 | 87,074.50 | 88,759.92 | 91,488.01 |
| Pivot points | S3 | S2 | S1 | PP | R1 | R2 | R3 |
|---|---|---|---|---|---|---|---|
| Standard | 53,913.71 | 66,070.14 | 75,197.80 | 87,354.23 | 96,481.89 | 108,638.32 | 117,765.98 |
| Camarilla | 78,472.35 | 80,423.39 | 82,374.43 | 84,325.47 | 86,276.51 | 88,227.55 | 90,178.60 |
| Woodie | 52,399.34 | 65,312.95 | 73,683.43 | 86,597.04 | 94,967.52 | 107,881.13 | 116,251.61 |
| Fibonacci | 66,070.14 | 74,200.66 | 79,223.70 | 87,354.23 | 95,484.75 | 100,507.79 | 108,638.32 |
Numerical data
The following are the details of the technical indicators and moving averages that were collected to generate this technical analysis:
| RSI (14): | 45.41 | |
| MACD (12,26,9): | -159.9800 | |
| Directional Movement: | -12.28 | |
| AROON (14): | -50.00 | |
| DEMA (21): | 82,618.09 | |
| Parabolic SAR (0,02-0,02-0,2): | 83,126.86 | |
| Elder Ray (13): | -53.30 | |
| Super Trend (3,10): | 83,529.60 | |
| Zig ZAG (10): | 82,731.95 | |
| VORTEX (21): | 1.0600 | |
| Stochastique (14,3,5): | 38.88 | |
| TEMA (21): | 82,733.52 | |
| Williams %R (14): | -52.76 | |
| Chande Momentum Oscillator (20): | -315.20 | |
| Repulse (5,40,3): | 0.1900 | |
| ROCnROLL: | -1 | |
| TRIX (15,9): | -0.0200 | |
| Courbe Coppock: | 0.88 |
| MA7: | 85,564.02 | |
| MA20: | 84,457.77 | |
| MA50: | 88,796.85 | |
| MA100: | 93,733.68 | |
| MAexp7: | 82,709.32 | |
| MAexp20: | 82,835.68 | |
| MAexp50: | 83,387.68 | |
| MAexp100: | 84,269.71 | |
| Price / MA7: | -3.45% | |
| Price / MA20: | -2.19% | |
| Price / MA50: | -6.97% | |
| Price / MA100: | -11.87% | |
| Price / MAexp7: | -0.12% | |
| Price / MAexp20: | -0.27% | |
| Price / MAexp50: | -0.93% | |
| Price / MAexp100: | -1.97% |
About author

Online


Add a comment
Comments
0 comments on the analysis BITCOIN - BTC/USD - 1H