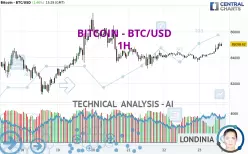
BITCOIN - BTC/USD - 1H - Technical analysis published on 03/23/2025 (GMT)
- 78
- 0
Click here for a new analysis!
- Timeframe : 1H
- - Analysis generated on
- Status : TARGET REACHED

Summary of the analysis

Additional analysis
Quotes
BITCOIN - BTC/USD rating 85,059.87 USD. On the day, this instrument gained +1.46% and was traded between 83,800.16 USD and 85,188.35 USD over the period. The price is currently at +1.50% from its lowest and -0.15% from its highest.A bullish opening was detected by the Central Gaps scanner. Buyers are trying to impose a bullish momentum in the very short term.
Bullish opening
Type : Bullish
Timeframe : Openning
Here is a more detailed summary of the historical variations registered by BITCOIN - BTC/USD:
Technical
A technical analysis in 1H of this BITCOIN - BTC/USD chart shows a strongly bullish trend. 85.71% of the signals given by moving averages are bullish. This strongly bullish trend is supported by the strong bullish signals given by short-term moving averages. There is no crossing of moving average by the price or crossing of moving averages between themselves.
In fact, according to the parameters integrated into the Central Analyzer system, 15 technical indicators out of 18 analysed are currently bullish. Caution: the Central Indicators scanner currently detects an excess:
CCI indicator is overbought : over 100
Type : Neutral
Timeframe : 1 hour
Williams %R indicator is overbought : over -20
Type : Neutral
Timeframe : 1 hour
Pivot points : price is over resistance 2 (Daily)
Type : Neutral
Timeframe : 1 hour
Price is back over the pivot point (Daily)
Type : Bullish
Timeframe : Weekly
Central Patterns, the scanner specializing in chart patterns, did not identify any signals.
The presence of these Japanese chandelier patterns detected by Central Candlesticks that could impact the current short-term trend were also noted:
Bullish harami
Type : Bullish
Timeframe : 1 hour
Bullish harami cross
Type : Bullish
Timeframe : 1 hour
Bearish engulfing lines
Type : Bearish
Timeframe : 1 hour
| S3 | S2 | S1 | Price | R1 | R2 | R3 | |
|---|---|---|---|---|---|---|---|
| ProTrendLines | 83,622.38 | 84,275.89 | 84,765.96 | 85,059.87 | 85,300.96 | 86,499.48 | 87,459.73 |
| Change (%) | -1.69% | -0.92% | -0.35% | - | +0.28% | +1.69% | +2.82% |
| Change | -1,437.49 | -783.98 | -293.91 | - | +241.09 | +1,439.61 | +2,399.86 |
| Level | Intermediate | Intermediate | Major | - | Minor | Minor | Minor |
Pivot points can also be used to set your price objectives. Here is the price situation in relation to pivot points:
| Pivot points | S3 | S2 | S1 | PP | R1 | R2 | R3 |
|---|---|---|---|---|---|---|---|
| Standard | 82,672.87 | 83,171.29 | 83,503.87 | 84,002.29 | 84,334.87 | 84,833.29 | 85,165.87 |
| Camarilla | 83,607.93 | 83,684.10 | 83,760.28 | 83,836.45 | 83,912.63 | 83,988.80 | 84,064.98 |
| Woodie | 82,589.95 | 83,129.83 | 83,420.95 | 83,960.83 | 84,251.95 | 84,791.83 | 85,082.95 |
| Fibonacci | 83,171.29 | 83,488.73 | 83,684.85 | 84,002.29 | 84,319.73 | 84,515.85 | 84,833.29 |
| Pivot points | S3 | S2 | S1 | PP | R1 | R2 | R3 |
|---|---|---|---|---|---|---|---|
| Standard | 74,512.03 | 77,826.22 | 80,831.34 | 84,145.53 | 87,150.65 | 90,464.84 | 93,469.96 |
| Camarilla | 82,098.64 | 82,677.91 | 83,257.18 | 83,836.45 | 84,415.72 | 84,994.99 | 85,574.26 |
| Woodie | 74,357.49 | 77,748.95 | 80,676.80 | 84,068.26 | 86,996.11 | 90,387.57 | 93,315.42 |
| Fibonacci | 77,826.22 | 80,240.20 | 81,731.56 | 84,145.53 | 86,559.51 | 88,050.87 | 90,464.84 |
| Pivot points | S3 | S2 | S1 | PP | R1 | R2 | R3 |
|---|---|---|---|---|---|---|---|
| Standard | 49,862.18 | 64,044.37 | 74,184.92 | 88,367.11 | 98,507.66 | 112,689.85 | 122,830.40 |
| Camarilla | 77,636.72 | 79,866.30 | 82,095.89 | 84,325.47 | 86,555.06 | 88,784.64 | 91,014.22 |
| Woodie | 47,841.36 | 63,033.96 | 72,164.10 | 87,356.70 | 96,486.84 | 111,679.44 | 120,809.58 |
| Fibonacci | 64,044.37 | 73,335.66 | 79,075.82 | 88,367.11 | 97,658.40 | 103,398.56 | 112,689.85 |
Numerical data
The following are the details of the technical indicators and moving averages that were collected to generate this technical analysis:
| RSI (14): | 67.40 | |
| MACD (12,26,9): | 191.3100 | |
| Directional Movement: | 25.93 | |
| AROON (14): | 92.86 | |
| DEMA (21): | 84,681.70 | |
| Parabolic SAR (0,02-0,02-0,2): | 84,406.80 | |
| Elder Ray (13): | 337.21 | |
| Super Trend (3,10): | 84,315.36 | |
| Zig ZAG (10): | 84,896.39 | |
| VORTEX (21): | 1.1600 | |
| Stochastique (14,3,5): | 83.70 | |
| TEMA (21): | 84,855.70 | |
| Williams %R (14): | -21.71 | |
| Chande Momentum Oscillator (20): | 708.84 | |
| Repulse (5,40,3): | 0.1700 | |
| ROCnROLL: | 1 | |
| TRIX (15,9): | 0.0200 | |
| Courbe Coppock: | 1.64 |
| MA7: | 84,378.22 | |
| MA20: | 84,463.15 | |
| MA50: | 90,459.42 | |
| MA100: | 94,867.42 | |
| MAexp7: | 84,760.12 | |
| MAexp20: | 84,469.82 | |
| MAexp50: | 84,329.10 | |
| MAexp100: | 84,223.00 | |
| Price / MA7: | +0.81% | |
| Price / MA20: | +0.71% | |
| Price / MA50: | -5.97% | |
| Price / MA100: | -10.34% | |
| Price / MAexp7: | +0.35% | |
| Price / MAexp20: | +0.70% | |
| Price / MAexp50: | +0.87% | |
| Price / MAexp100: | +0.99% |
About author

Online


Add a comment
Comments
0 comments on the analysis BITCOIN - BTC/USD - 1H