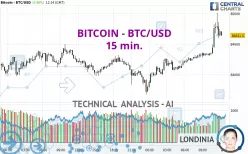
BITCOIN - BTC/USD - 15 min. - Technical analysis published on 03/23/2025 (GMT)
- 89
- 0
Click here for a new analysis!
- Timeframe : 15 min.
- - Analysis generated on
- Status : TARGET REACHED

Summary of the analysis

Additional analysis
Quotes
The BITCOIN - BTC/USD price is 84,641.39 USD. The price registered an increase of +0.96% on the session and was traded between 83,800.16 USD and 85,012.12 USD over the period. The price is currently at +1.00% from its lowest and -0.44% from its highest.The Central Gaps scanner detects a bullish opening marking the presence of buyers ahead of sellers at the opening but not sufficiently marked to allow the price to register a quotation gap.
Bullish opening
Type : Bullish
Timeframe : Openning
Here is a more detailed summary of the historical variations registered by BITCOIN - BTC/USD:
Technical
Technical analysis of this 15 min. chart of BITCOIN - BTC/USD indicates that the overall trend is strongly bullish. 92.86% of the signals given by moving averages are bullish. This strongly bullish trend is supported by the strong bullish signals given by short-term moving averages. The Central Indicators scanner detects a bearish signal on moving averages that could impact this trend:
Bearish price crossover with adaptative moving average 20
Type : Bearish
Timeframe : 15 minutes
The probability of a further increase is high given the direction of the technical indicators.
Caution: the Central Indicators scanner currently detects an excess:
CCI indicator is overbought : over 100
Type : Neutral
Timeframe : 15 minutes
Pivot points : price is over resistance 1 (Daily)
Type : Neutral
Timeframe : 15 minutes
Price is back over the pivot point (Daily)
Type : Bullish
Timeframe : Weekly
Williams %R indicator is back over -50
Type : Bullish
Timeframe : 15 minutes
Central Patterns, the scanner specializing in chart patterns, did not identify any signals.
The presence of these Japanese chandelier patterns detected by Central Candlesticks that could impact the current short-term trend were also noted:
Bullish doji star
Type : Bullish
Timeframe : 15 minutes
Doji
Type : Neutral
Timeframe : 15 minutes
| S3 | S2 | S1 | Price | R1 | R2 | R3 | |
|---|---|---|---|---|---|---|---|
| ProTrendLines | 81,997.48 | 83,622.38 | 84,275.89 | 84,641.39 | 84,765.96 | 85,300.96 | 86,499.48 |
| Change (%) | -3.12% | -1.20% | -0.43% | - | +0.15% | +0.78% | +2.20% |
| Change | -2,643.91 | -1,019.01 | -365.50 | - | +124.57 | +659.57 | +1,858.09 |
| Level | Intermediate | Intermediate | Intermediate | - | Major | Minor | Minor |
To determine price objectives, it is also possible to use the pivot points. Here is the price position in relation to pivot points:
| Pivot points | S3 | S2 | S1 | PP | R1 | R2 | R3 |
|---|---|---|---|---|---|---|---|
| Standard | 82,672.87 | 83,171.29 | 83,503.87 | 84,002.29 | 84,334.87 | 84,833.29 | 85,165.87 |
| Camarilla | 83,607.93 | 83,684.10 | 83,760.28 | 83,836.45 | 83,912.63 | 83,988.80 | 84,064.98 |
| Woodie | 82,589.95 | 83,129.83 | 83,420.95 | 83,960.83 | 84,251.95 | 84,791.83 | 85,082.95 |
| Fibonacci | 83,171.29 | 83,488.73 | 83,684.85 | 84,002.29 | 84,319.73 | 84,515.85 | 84,833.29 |
| Pivot points | S3 | S2 | S1 | PP | R1 | R2 | R3 |
|---|---|---|---|---|---|---|---|
| Standard | 74,512.03 | 77,826.22 | 80,831.34 | 84,145.53 | 87,150.65 | 90,464.84 | 93,469.96 |
| Camarilla | 82,098.64 | 82,677.91 | 83,257.18 | 83,836.45 | 84,415.72 | 84,994.99 | 85,574.26 |
| Woodie | 74,357.49 | 77,748.95 | 80,676.80 | 84,068.26 | 86,996.11 | 90,387.57 | 93,315.42 |
| Fibonacci | 77,826.22 | 80,240.20 | 81,731.56 | 84,145.53 | 86,559.51 | 88,050.87 | 90,464.84 |
| Pivot points | S3 | S2 | S1 | PP | R1 | R2 | R3 |
|---|---|---|---|---|---|---|---|
| Standard | 49,862.18 | 64,044.37 | 74,184.92 | 88,367.11 | 98,507.66 | 112,689.85 | 122,830.40 |
| Camarilla | 77,636.72 | 79,866.30 | 82,095.89 | 84,325.47 | 86,555.06 | 88,784.64 | 91,014.22 |
| Woodie | 47,841.36 | 63,033.96 | 72,164.10 | 87,356.70 | 96,486.84 | 111,679.44 | 120,809.58 |
| Fibonacci | 64,044.37 | 73,335.66 | 79,075.82 | 88,367.11 | 97,658.40 | 103,398.56 | 112,689.85 |
Numerical data
The following are the details of the technical indicators and moving averages that were collected to generate this technical analysis:
| RSI (14): | 66.30 | |
| MACD (12,26,9): | 142.2800 | |
| Directional Movement: | 26.24 | |
| AROON (14): | 64.28 | |
| DEMA (21): | 84,660.51 | |
| Parabolic SAR (0,02-0,02-0,2): | 84,596.84 | |
| Elder Ray (13): | 127.85 | |
| Super Trend (3,10): | 84,496.13 | |
| Zig ZAG (10): | 84,718.71 | |
| VORTEX (21): | 1.2000 | |
| Stochastique (14,3,5): | 61.74 | |
| TEMA (21): | 84,740.90 | |
| Williams %R (14): | -37.99 | |
| Chande Momentum Oscillator (20): | 404.98 | |
| Repulse (5,40,3): | 0.0800 | |
| ROCnROLL: | 1 | |
| TRIX (15,9): | 0.0200 | |
| Courbe Coppock: | 0.86 |
| MA7: | 84,345.41 | |
| MA20: | 84,452.30 | |
| MA50: | 90,455.12 | |
| MA100: | 94,865.17 | |
| MAexp7: | 84,665.04 | |
| MAexp20: | 84,487.48 | |
| MAexp50: | 84,322.37 | |
| MAexp100: | 84,243.63 | |
| Price / MA7: | +0.35% | |
| Price / MA20: | +0.22% | |
| Price / MA50: | -6.43% | |
| Price / MA100: | -10.78% | |
| Price / MAexp7: | -0.03% | |
| Price / MAexp20: | +0.18% | |
| Price / MAexp50: | +0.38% | |
| Price / MAexp100: | +0.47% |
About author

Online


Add a comment
Comments
0 comments on the analysis BITCOIN - BTC/USD - 15 min.