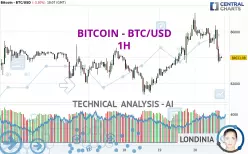
BITCOIN - BTC/USD - 1H - Technical analysis published on 03/20/2025 (GMT)
- 286
- 0
Click here for a new analysis!
- Timeframe : 1H
- - Analysis generated on
- Status : LEVEL MAINTAINED

Summary of the analysis

Additional analysis
Quotes
The BITCOIN - BTC/USD price is 84,011.07 USD. The price registered a decrease of -3.30% on the session with the lowest point at 83,612.42 USD and the highest point at 87,459.73 USD. The deviation from the price is +0.48% for the low point and -3.94% for the high point.A bullish opening was detected by the Central Gaps scanner. Buyers are trying to impose a bullish momentum in the very short term.
Bullish opening
Type : Bullish
Timeframe : Openning
Here is a more detailed summary of the historical variations registered by BITCOIN - BTC/USD:
Technical
A technical analysis in 1H of this BITCOIN - BTC/USD chart shows a neutral trend. The trend could quickly turn bearish due to the strong bearish signals currently being given by short-term moving averages. The Central Indicators scanner does not detect any result on moving averages that would impact this trend.
The technical indicators are generally neutral. They do not provide relevant information on the direction of future price movements.
But beware of excesses. The Central Indicators scanner currently detects this:
CCI indicator is oversold : under -100
Type : Neutral
Timeframe : 1 hour
Previous candle closed under Bollinger bands
Type : Neutral
Timeframe : 1 hour
Williams %R indicator is oversold : under -80
Type : Neutral
Timeframe : 1 hour
Pivot points : price is under support 1 (Daily)
Type : Neutral
Timeframe : 1 hour
MACD indicator is back under 0
Type : Bearish
Timeframe : 1 hour
No signals are given by Central Patterns, a market scanner specialised in chart patterns, resistances and supports.
No result was found by the Central Candlesticks scanner on Japanese candlesticks.
| S3 | S2 | S1 | Price | R1 | R2 | R3 | |
|---|---|---|---|---|---|---|---|
| ProTrendLines | 79,924.19 | 81,140.42 | 82,427.46 | 84,011.07 | 84,126.03 | 84,727.58 | 92,549.70 |
| Change (%) | -4.86% | -3.42% | -1.89% | - | +0.14% | +0.85% | +10.16% |
| Change | -4,086.88 | -2,870.65 | -1,583.61 | - | +114.96 | +716.51 | +8,538.63 |
| Level | Minor | Minor | Intermediate | - | Minor | Intermediate | Intermediate |
Pivot points can also be used to set your price objectives. Here is the price situation in relation to pivot points:
| Pivot points | S3 | S2 | S1 | PP | R1 | R2 | R3 |
|---|---|---|---|---|---|---|---|
| Standard | 79,482.75 | 81,021.62 | 83,949.10 | 85,487.97 | 88,415.45 | 89,954.32 | 92,881.80 |
| Camarilla | 85,648.34 | 86,057.76 | 86,467.18 | 86,876.59 | 87,286.01 | 87,695.42 | 88,104.84 |
| Woodie | 80,177.07 | 81,368.77 | 84,643.42 | 85,835.12 | 89,109.77 | 90,301.47 | 93,576.12 |
| Fibonacci | 81,021.62 | 82,727.76 | 83,781.82 | 85,487.97 | 87,194.11 | 88,248.17 | 89,954.32 |
| Pivot points | S3 | S2 | S1 | PP | R1 | R2 | R3 |
|---|---|---|---|---|---|---|---|
| Standard | 68,567.49 | 72,585.77 | 78,468.29 | 82,486.57 | 88,369.09 | 92,387.37 | 98,269.89 |
| Camarilla | 81,628.09 | 82,535.66 | 83,443.24 | 84,350.81 | 85,258.38 | 86,165.96 | 87,073.53 |
| Woodie | 69,499.61 | 73,051.83 | 79,400.41 | 82,952.63 | 89,301.21 | 92,853.43 | 99,202.01 |
| Fibonacci | 72,585.77 | 76,367.88 | 78,704.46 | 82,486.57 | 86,268.68 | 88,605.26 | 92,387.37 |
| Pivot points | S3 | S2 | S1 | PP | R1 | R2 | R3 |
|---|---|---|---|---|---|---|---|
| Standard | 49,577.85 | 63,902.20 | 74,113.84 | 88,438.19 | 98,649.83 | 112,974.18 | 123,185.82 |
| Camarilla | 77,578.07 | 79,827.21 | 82,076.34 | 84,325.47 | 86,574.60 | 88,823.74 | 91,072.87 |
| Woodie | 47,521.49 | 62,874.02 | 72,057.48 | 87,410.01 | 96,593.47 | 111,946.00 | 121,129.46 |
| Fibonacci | 63,902.20 | 73,274.95 | 79,065.45 | 88,438.19 | 97,810.94 | 103,601.44 | 112,974.18 |
Numerical data
The following is the status of technical indicators and moving averages registered at the time this technical analysis was created:
| RSI (14): | 38.48 | |
| MACD (12,26,9): | 98.9100 | |
| Directional Movement: | -6.23 | |
| AROON (14): | -14.29 | |
| DEMA (21): | 85,554.57 | |
| Parabolic SAR (0,02-0,02-0,2): | 87,097.95 | |
| Elder Ray (13): | -988.21 | |
| Super Trend (3,10): | 86,611.98 | |
| Zig ZAG (10): | 83,651.30 | |
| VORTEX (21): | 0.9100 | |
| Stochastique (14,3,5): | 29.37 | |
| TEMA (21): | 85,189.35 | |
| Williams %R (14): | -92.26 | |
| Chande Momentum Oscillator (20): | -1,884.48 | |
| Repulse (5,40,3): | -2.6100 | |
| ROCnROLL: | 2 | |
| TRIX (15,9): | 0.0700 | |
| Courbe Coppock: | 1.93 |
| MA7: | 84,048.06 | |
| MA20: | 85,142.26 | |
| MA50: | 91,554.65 | |
| MA100: | 95,362.66 | |
| MAexp7: | 84,711.71 | |
| MAexp20: | 85,276.42 | |
| MAexp50: | 84,677.79 | |
| MAexp100: | 84,106.41 | |
| Price / MA7: | -0.04% | |
| Price / MA20: | -1.33% | |
| Price / MA50: | -8.24% | |
| Price / MA100: | -11.90% | |
| Price / MAexp7: | -0.83% | |
| Price / MAexp20: | -1.48% | |
| Price / MAexp50: | -0.79% | |
| Price / MAexp100: | -0.11% |
About author

Online


Add a comment
Comments
0 comments on the analysis BITCOIN - BTC/USD - 1H