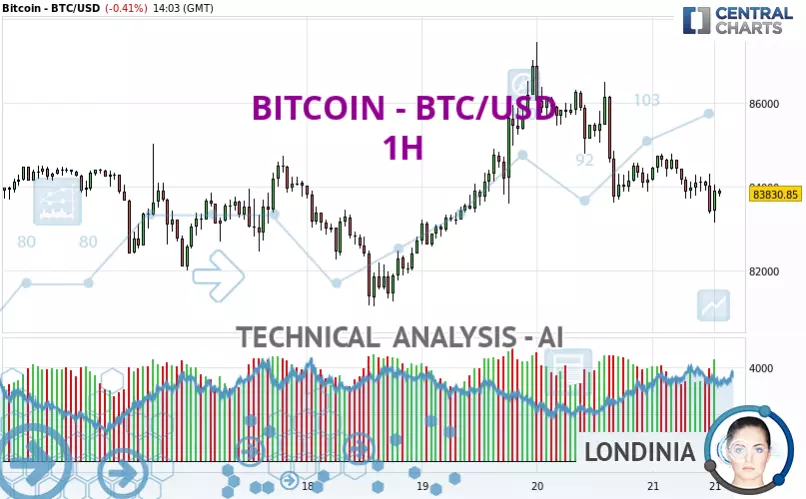
BITCOIN - BTC/USD - 1H - Technical analysis published on 03/21/2025 (GMT)
- 214
- 0
Click here for a new analysis!
- Timeframe : 1H
- - Analysis generated on
- Status : LEVEL MAINTAINED

Summary of the analysis

Additional analysis
Quotes
BITCOIN - BTC/USD rating 83,833.35 USD. The price is lower by -0.41% since the last closing with the lowest point at 83,144.65 USD and the highest point at 84,791.77 USD. The deviation from the price is +0.83% for the low point and -1.13% for the high point.A bullish opening was detected by the Central Gaps scanner. Buyers are trying to impose a bullish momentum in the very short term.
Bullish opening
Type : Bullish
Timeframe : Openning
So that you have an overall view of the price change, here is a table showing the variations over several periods:
Technical
Technical analysis of BITCOIN - BTC/USD in 1H shows an overall bearish trend. 78.57% of the signals given by moving averages are bearish. This bearish trend is supported by the strong bearish signals given by short-term moving averages. The Central Indicators scanner detects bearish signals on moving averages that could impact this trend:
Bearish trend reversal : Moving Average 50
Type : Bearish
Timeframe : 1 hour
Bearish trend reversal : Moving Average 100
Type : Bearish
Timeframe : 1 hour
On the 18 technical indicators analysed, 4 are bullish, 3 are neutral and 11 are bearish. Caution: the Central Indicators scanner currently detects an excess:
CCI indicator is oversold : under -100
Type : Neutral
Timeframe : 1 hour
Previous candle closed under Bollinger bands
Type : Neutral
Timeframe : 1 hour
Williams %R indicator is oversold : under -80
Type : Neutral
Timeframe : 1 hour
No signals are given by Central Patterns, a market scanner specialised in chart patterns, resistances and supports.
From the Japanese candlestick perspective, the Central Candlesticks scanner notes the presence of these results that could impact the short-term trend:
Black hanging man / hammer
Type : Neutral
Timeframe : 1 hour
Doji
Type : Neutral
Timeframe : 1 hour
| S3 | S2 | S1 | Price | R1 | R2 | R3 | |
|---|---|---|---|---|---|---|---|
| ProTrendLines | 81,140.42 | 82,427.46 | 83,622.38 | 83,833.35 | 84,275.89 | 85,300.96 | 86,499.48 |
| Change (%) | -3.21% | -1.68% | -0.25% | - | +0.53% | +1.75% | +3.18% |
| Change | -2,692.93 | -1,405.89 | -210.97 | - | +442.54 | +1,467.61 | +2,666.13 |
| Level | Minor | Intermediate | Intermediate | - | Major | Minor | Minor |
Attention could also be paid to pivot points to set price objectives:
| Pivot points | S3 | S2 | S1 | PP | R1 | R2 | R3 |
|---|---|---|---|---|---|---|---|
| Standard | 78,859.89 | 81,236.16 | 82,707.20 | 85,083.47 | 86,554.51 | 88,930.78 | 90,401.82 |
| Camarilla | 83,120.24 | 83,472.91 | 83,825.58 | 84,178.25 | 84,530.92 | 84,883.59 | 85,236.26 |
| Woodie | 78,407.29 | 81,009.85 | 82,254.60 | 84,857.16 | 86,101.91 | 88,704.47 | 89,949.22 |
| Fibonacci | 81,236.16 | 82,705.83 | 83,613.79 | 85,083.47 | 86,553.14 | 87,461.10 | 88,930.78 |
| Pivot points | S3 | S2 | S1 | PP | R1 | R2 | R3 |
|---|---|---|---|---|---|---|---|
| Standard | 68,567.49 | 72,585.77 | 78,468.29 | 82,486.57 | 88,369.09 | 92,387.37 | 98,269.89 |
| Camarilla | 81,628.09 | 82,535.66 | 83,443.24 | 84,350.81 | 85,258.38 | 86,165.96 | 87,073.53 |
| Woodie | 69,499.61 | 73,051.83 | 79,400.41 | 82,952.63 | 89,301.21 | 92,853.43 | 99,202.01 |
| Fibonacci | 72,585.77 | 76,367.88 | 78,704.46 | 82,486.57 | 86,268.68 | 88,605.26 | 92,387.37 |
| Pivot points | S3 | S2 | S1 | PP | R1 | R2 | R3 |
|---|---|---|---|---|---|---|---|
| Standard | 49,577.85 | 63,902.20 | 74,113.84 | 88,438.19 | 98,649.83 | 112,974.18 | 123,185.82 |
| Camarilla | 77,578.07 | 79,827.21 | 82,076.34 | 84,325.47 | 86,574.60 | 88,823.74 | 91,072.87 |
| Woodie | 47,521.49 | 62,874.02 | 72,057.48 | 87,410.01 | 96,593.47 | 111,946.00 | 121,129.46 |
| Fibonacci | 63,902.20 | 73,274.95 | 79,065.45 | 88,438.19 | 97,810.94 | 103,601.44 | 112,974.18 |
Numerical data
The following are the details of the technical indicators and moving averages that were collected to generate this technical analysis:
| RSI (14): | 35.65 | |
| MACD (12,26,9): | -311.3900 | |
| Directional Movement: | -14.98 | |
| AROON (14): | -78.57 | |
| DEMA (21): | 83,816.82 | |
| Parabolic SAR (0,02-0,02-0,2): | 84,522.59 | |
| Elder Ray (13): | -545.67 | |
| Super Trend (3,10): | 85,041.25 | |
| Zig ZAG (10): | 83,631.71 | |
| VORTEX (21): | 0.9500 | |
| Stochastique (14,3,5): | 23.01 | |
| TEMA (21): | 83,687.41 | |
| Williams %R (14): | -59.09 | |
| Chande Momentum Oscillator (20): | -865.07 | |
| Repulse (5,40,3): | 0.1000 | |
| ROCnROLL: | 2 | |
| TRIX (15,9): | -0.0400 | |
| Courbe Coppock: | 0.90 |
| MA7: | 84,089.93 | |
| MA20: | 85,034.19 | |
| MA50: | 91,137.61 | |
| MA100: | 95,189.20 | |
| MAexp7: | 83,939.96 | |
| MAexp20: | 84,211.75 | |
| MAexp50: | 84,364.50 | |
| MAexp100: | 84,115.16 | |
| Price / MA7: | -0.31% | |
| Price / MA20: | -1.41% | |
| Price / MA50: | -8.01% | |
| Price / MA100: | -11.93% | |
| Price / MAexp7: | -0.13% | |
| Price / MAexp20: | -0.45% | |
| Price / MAexp50: | -0.63% | |
| Price / MAexp100: | -0.34% |
About author

Online


Add a comment
Comments
0 comments on the analysis BITCOIN - BTC/USD - 1H