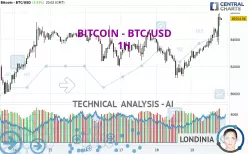
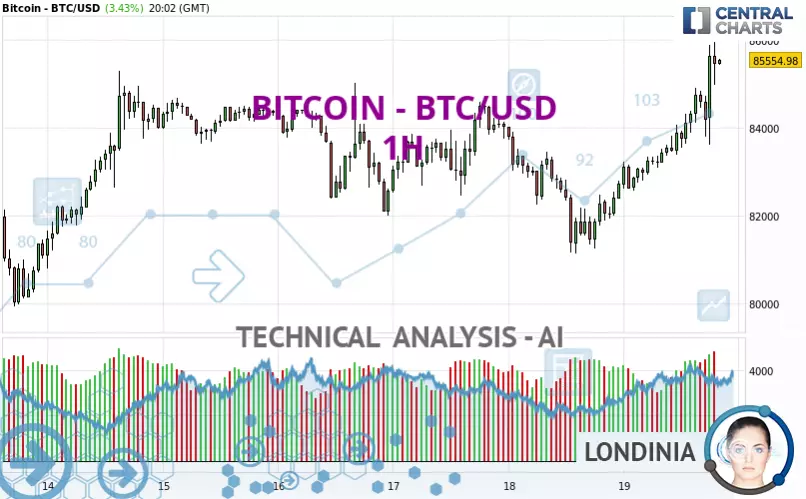
BITCOIN - BTC/USD - 1H - Technical analysis published on 03/19/2025 (GMT)
- 122
- 0
Click here for a new analysis!
- Timeframe : 1H
- - Analysis generated on
- Status : LEVEL MAINTAINED
Summary of the analysis

Additional analysis
Quotes
The BITCOIN - BTC/USD price is 85,553.09 USD. On the day, this instrument gained +3.43% and was between 82,560.48 USD and 85,963.02 USD. This implies that the price is at +3.62% from its lowest and at -0.48% from its highest.So that you have an overall view of the price change, here is a table showing the variations over several periods:
Technical
Technical analysis of this 1H chart of BITCOIN - BTC/USD indicates that the overall trend is strongly bullish. 89.29% of the signals given by moving averages are bullish. This strongly bullish trend is supported by the strong bullish signals given by short-term moving averages. The Central Indicators scanner does not detect any result on moving averages that would impact this trend.
Technical indicators are strongly bullish, suggesting that the price increase should continue.
Caution: the Central Indicators scanner currently detects an excess:
RSI indicator is overbought : over 70
Type : Neutral
Timeframe : 1 hour
Previous candle closed over Bollinger bands
Type : Neutral
Timeframe : 1 hour
RSI indicator: bearish divergence
Type : Bearish
Timeframe : 1 hour
Pivot points : price is over resistance 2 (Daily)
Type : Neutral
Timeframe : 1 hour
The Central Patterns scanner, which studies chart patterns, resistances and supports, has identified this signal:
Resistance of channel is broken
Type : Bullish
Timeframe : 1 hour
For a small setback in the very short term, the Central Candlesticks scanner currently notes the presence of this bearish pattern in Japanese candlesticks:
Bearish harami
Type : Bearish
Timeframe : 1 hour
Bearish harami cross
Type : Bearish
Timeframe : 1 hour
| S3 | S2 | S1 | Price | R1 | R2 | R3 | |
|---|---|---|---|---|---|---|---|
| ProTrendLines | 82,427.46 | 84,126.03 | 85,300.96 | 85,553.09 | 92,549.70 | 98,676.15 | 106,152.18 |
| Change (%) | -3.65% | -1.67% | -0.29% | - | +8.18% | +15.34% | +24.08% |
| Change | -3,125.63 | -1,427.06 | -252.13 | - | +6,996.61 | +13,123.06 | +20,599.09 |
| Level | Intermediate | Major | Minor | - | Intermediate | Minor | Major |
To determine price objectives, it is also possible to use the pivot points. Here is the price position in relation to pivot points:
| Pivot points | S3 | S2 | S1 | PP | R1 | R2 | R3 |
|---|---|---|---|---|---|---|---|
| Standard | 78,330.41 | 79,735.41 | 81,225.96 | 82,630.96 | 84,121.51 | 85,526.51 | 87,017.06 |
| Camarilla | 81,920.22 | 82,185.65 | 82,451.08 | 82,716.50 | 82,981.93 | 83,247.35 | 83,512.78 |
| Woodie | 78,373.18 | 79,756.80 | 81,268.73 | 82,652.35 | 84,164.28 | 85,547.90 | 87,059.83 |
| Fibonacci | 79,735.41 | 80,841.51 | 81,524.86 | 82,630.96 | 83,737.06 | 84,420.41 | 85,526.51 |
| Pivot points | S3 | S2 | S1 | PP | R1 | R2 | R3 |
|---|---|---|---|---|---|---|---|
| Standard | 68,567.49 | 72,585.77 | 78,468.29 | 82,486.57 | 88,369.09 | 92,387.37 | 98,269.89 |
| Camarilla | 81,628.09 | 82,535.66 | 83,443.24 | 84,350.81 | 85,258.38 | 86,165.96 | 87,073.53 |
| Woodie | 69,499.61 | 73,051.83 | 79,400.41 | 82,952.63 | 89,301.21 | 92,853.43 | 99,202.01 |
| Fibonacci | 72,585.77 | 76,367.88 | 78,704.46 | 82,486.57 | 86,268.68 | 88,605.26 | 92,387.37 |
| Pivot points | S3 | S2 | S1 | PP | R1 | R2 | R3 |
|---|---|---|---|---|---|---|---|
| Standard | 49,577.85 | 63,902.20 | 74,113.84 | 88,438.19 | 98,649.83 | 112,974.18 | 123,185.82 |
| Camarilla | 77,578.07 | 79,827.21 | 82,076.34 | 84,325.47 | 86,574.60 | 88,823.74 | 91,072.87 |
| Woodie | 47,521.49 | 62,874.02 | 72,057.48 | 87,410.01 | 96,593.47 | 111,946.00 | 121,129.46 |
| Fibonacci | 63,902.20 | 73,274.95 | 79,065.45 | 88,438.19 | 97,810.94 | 103,601.44 | 112,974.18 |
Numerical data
The following is the status of technical indicators and moving averages registered at the time this technical analysis was created:
| RSI (14): | 65.66 | |
| MACD (12,26,9): | 596.1700 | |
| Directional Movement: | 19.42 | |
| AROON (14): | 100.00 | |
| DEMA (21): | 84,665.08 | |
| Parabolic SAR (0,02-0,02-0,2): | 83,605.34 | |
| Elder Ray (13): | 1,157.76 | |
| Super Trend (3,10): | 83,295.95 | |
| Zig ZAG (10): | 85,471.41 | |
| VORTEX (21): | 1.2500 | |
| Stochastique (14,3,5): | 79.59 | |
| TEMA (21): | 85,162.20 | |
| Williams %R (14): | -19.87 | |
| Chande Momentum Oscillator (20): | 2,175.78 | |
| Repulse (5,40,3): | 1.1100 | |
| ROCnROLL: | 1 | |
| TRIX (15,9): | 0.0700 | |
| Courbe Coppock: | 4.04 |
| MA7: | 83,438.56 | |
| MA20: | 85,067.49 | |
| MA50: | 91,915.59 | |
| MA100: | 95,474.02 | |
| MAexp7: | 84,741.31 | |
| MAexp20: | 83,955.39 | |
| MAexp50: | 83,460.32 | |
| MAexp100: | 83,315.32 | |
| Price / MA7: | +2.53% | |
| Price / MA20: | +0.57% | |
| Price / MA50: | -6.92% | |
| Price / MA100: | -10.39% | |
| Price / MAexp7: | +0.96% | |
| Price / MAexp20: | +1.91% | |
| Price / MAexp50: | +2.51% | |
| Price / MAexp100: | +2.69% |
About author

Online


Add a comment
Comments
0 comments on the analysis BITCOIN - BTC/USD - 1H