| Open: | - |
| Change: | - |
| Volume: | - |
| Low: | - |
| High: | - |
| High / Low range: | - |
| Type: | Cryptocurrencies |
| Ticker: | BTCUSD |
| ISIN: |
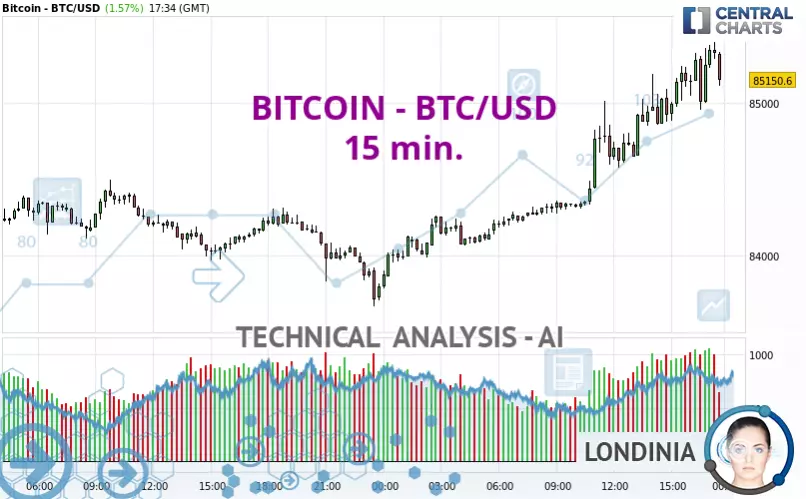
BITCOIN - BTC/USD - 15 min. - Technical analysis published on 03/23/2025 (GMT)
- 99
- 0
- 03/23/2025 - 17:34
Click here for a new analysis!
- Timeframe : 15 min.
- - Analysis generated on 03/23/2025 - 17:34
- Status : TARGET REACHED

Summary of the analysis

Additional analysis
Quotes
The BITCOIN - BTC/USD price is 85,155.16 USD. The price has increased by +1.57% since the last closing and was between 83,800.16 USD and 85,399.67 USD. This implies that the price is at +1.62% from its lowest and at -0.29% from its highest.The Central Gaps scanner detects a bullish opening marking the presence of buyers ahead of sellers at the opening but not sufficiently marked to allow the price to register a quotation gap.
Bullish opening
Type : Bullish
Timeframe : Openning
So that you have an overall view of the price change, here is a table showing the variations over several periods:
Technical
A technical analysis in 15 min. of this BITCOIN - BTC/USD chart shows a strongly bullish trend. 92.86% of the signals given by moving averages are bullish. The overall trend is supported by the strong bullish signals from short-term moving averages. The Central Indicators market scanner is currently detecting a bearish signal that could impact this trend:
Bearish price crossover with adaptative moving average 20
Type : Bearish
Timeframe : 15 minutes
In fact, according to the parameters integrated into the Central Analyzer system, 12 technical indicators out of 18 analysed are currently bullish. But beware of excesses. The Central Indicators scanner currently detects this:
CCI indicator is overbought : over 100
Type : Neutral
Timeframe : 15 minutes
MACD indicator: bearish divergence
Type : Bearish
Timeframe : 15 minutes
Williams %R indicator is overbought : over -20
Type : Neutral
Timeframe : 15 minutes
Pivot points : price is over resistance 3 (Daily)
Type : Neutral
Timeframe : 15 minutes
Price is back over the pivot point (Daily)
Type : Bullish
Timeframe : Weekly
No signals are given by Central Patterns, a market scanner specialised in chart patterns, resistances and supports.
Central Candlesticks, the scanner specialised in Japanese candlesticks, detects a bullish signal that could support the hypothesis of a small rebound in the very short term:
Bullish doji star
Type : Bullish
Timeframe : 15 minutes
| S3 | S2 | S1 | Price | R1 | R2 | R3 | |
|---|---|---|---|---|---|---|---|
| ProTrendLines | 83,622.38 | 84,275.89 | 84,765.96 | 85,155.16 | 85,300.96 | 86,499.48 | 87,459.73 |
| Change (%) | -1.80% | -1.03% | -0.46% | - | +0.17% | +1.58% | +2.71% |
| Change | -1,532.78 | -879.27 | -389.20 | - | +145.80 | +1,344.32 | +2,304.57 |
| Level | Intermediate | Intermediate | Major | - | Minor | Minor | Minor |
To determine price objectives, it is also possible to use the pivot points. Here is the price position in relation to pivot points:
| Pivot points | S3 | S2 | S1 | PP | R1 | R2 | R3 |
|---|---|---|---|---|---|---|---|
| Standard | 82,672.87 | 83,171.29 | 83,503.87 | 84,002.29 | 84,334.87 | 84,833.29 | 85,165.87 |
| Camarilla | 83,607.93 | 83,684.10 | 83,760.28 | 83,836.45 | 83,912.63 | 83,988.80 | 84,064.98 |
| Woodie | 82,589.95 | 83,129.83 | 83,420.95 | 83,960.83 | 84,251.95 | 84,791.83 | 85,082.95 |
| Fibonacci | 83,171.29 | 83,488.73 | 83,684.85 | 84,002.29 | 84,319.73 | 84,515.85 | 84,833.29 |
| Pivot points | S3 | S2 | S1 | PP | R1 | R2 | R3 |
|---|---|---|---|---|---|---|---|
| Standard | 74,512.03 | 77,826.22 | 80,831.34 | 84,145.53 | 87,150.65 | 90,464.84 | 93,469.96 |
| Camarilla | 82,098.64 | 82,677.91 | 83,257.18 | 83,836.45 | 84,415.72 | 84,994.99 | 85,574.26 |
| Woodie | 74,357.49 | 77,748.95 | 80,676.80 | 84,068.26 | 86,996.11 | 90,387.57 | 93,315.42 |
| Fibonacci | 77,826.22 | 80,240.20 | 81,731.56 | 84,145.53 | 86,559.51 | 88,050.87 | 90,464.84 |
| Pivot points | S3 | S2 | S1 | PP | R1 | R2 | R3 |
|---|---|---|---|---|---|---|---|
| Standard | 49,862.18 | 64,044.37 | 74,184.92 | 88,367.11 | 98,507.66 | 112,689.85 | 122,830.40 |
| Camarilla | 77,636.72 | 79,866.30 | 82,095.89 | 84,325.47 | 86,555.06 | 88,784.64 | 91,014.22 |
| Woodie | 47,841.36 | 63,033.96 | 72,164.10 | 87,356.70 | 96,486.84 | 111,679.44 | 120,809.58 |
| Fibonacci | 64,044.37 | 73,335.66 | 79,075.82 | 88,367.11 | 97,658.40 | 103,398.56 | 112,689.85 |
Numerical data
The following are the details of the technical indicators and moving averages that were collected to generate this technical analysis:
| RSI (14): | 65.79 | |
| MACD (12,26,9): | 184.1200 | |
| Directional Movement: | 12.66 | |
| AROON (14): | 85.72 | |
| DEMA (21): | 85,264.24 | |
| Parabolic SAR (0,02-0,02-0,2): | 84,958.80 | |
| Elder Ray (13): | 155.46 | |
| Super Trend (3,10): | 84,790.28 | |
| Zig ZAG (10): | 85,284.45 | |
| VORTEX (21): | 1.1800 | |
| Stochastique (14,3,5): | 77.66 | |
| TEMA (21): | 85,312.44 | |
| Williams %R (14): | -9.99 | |
| Chande Momentum Oscillator (20): | 282.66 | |
| Repulse (5,40,3): | 0.1500 | |
| ROCnROLL: | 1 | |
| TRIX (15,9): | 0.0300 | |
| Courbe Coppock: | 0.87 |
| MA7: | 84,436.75 | |
| MA20: | 84,481.02 | |
| MA50: | 90,466.62 | |
| MA100: | 94,871.02 | |
| MAexp7: | 85,218.97 | |
| MAexp20: | 85,017.64 | |
| MAexp50: | 84,721.91 | |
| MAexp100: | 84,500.41 | |
| Price / MA7: | +0.85% | |
| Price / MA20: | +0.80% | |
| Price / MA50: | -5.87% | |
| Price / MA100: | -10.24% | |
| Price / MAexp7: | -0.07% | |
| Price / MAexp20: | +0.16% | |
| Price / MAexp50: | +0.51% | |
| Price / MAexp100: | +0.77% |
About author

Online


Add a comment
Comments
0 comments on the analysis BITCOIN - BTC/USD - 15 min.