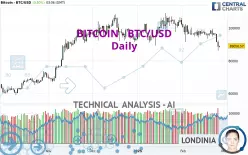
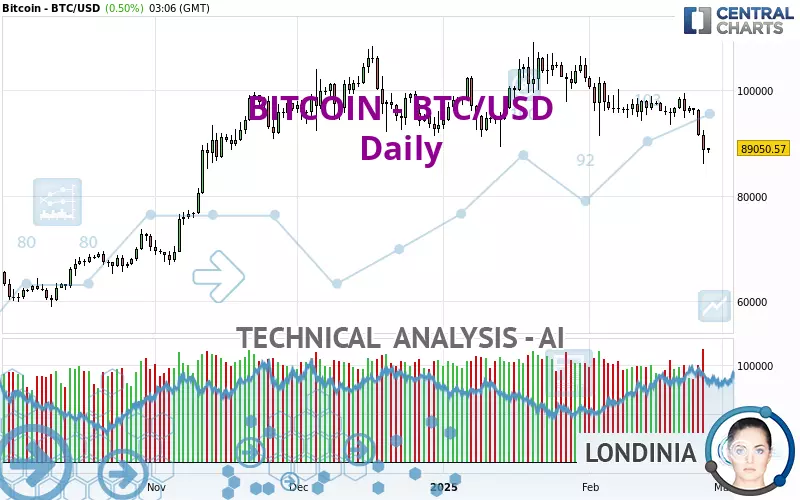
BITCOIN - BTC/USD - Daily - Technical analysis published on 02/26/2025 (GMT)
- 109
- 0
- Timeframe : Daily
- - Analysis generated on
- Status : IN PROGRESS...
Summary of the analysis

Additional analysis
Quotes
The BITCOIN - BTC/USD price is 89,050.45 USD. On the day, this instrument gained +0.50% and was between 88,052.66 USD and 89,090.29 USD. This implies that the price is at +1.13% from its lowest and at -0.04% from its highest.The Central Gaps scanner detects a bullish opening. A small advantage for buyers in the very short term.
Bullish opening
Type : Bullish
Timeframe : Openning
So that you have an overall view of the price change, here is a table showing the variations over several periods:
Near a new LOW record (1st january)
Type : Bearish
Timeframe : Weekly
Near a new LOW record (1 month)
Type : Bearish
Timeframe : Weekly
Technical
A technical analysis in Daily of this BITCOIN - BTC/USD chart shows a sharp bearish trend. 82.14% of the signals given by moving averages are bearish. The overall trend is supported by the strong bearish signals from short-term moving averages. An assessment of moving averages reveals a bearish signal that could impact this trend:
Bearish trend reversal : Moving Average 100
Type : Bearish
Timeframe : Daily
In fact, of the 18 technical indicators analysed by Central Analyzer, 4 are bullish, 4 are neutral and 10 are bearish. Caution: the Central Indicators scanner currently detects an excess:
CCI indicator is oversold : under -100
Type : Neutral
Timeframe : Daily
Previous candle closed under Bollinger bands
Type : Neutral
Timeframe : Daily
Williams %R indicator is oversold : under -80
Type : Neutral
Timeframe : Daily
Pivot points : price is under support 3
Type : Neutral
Timeframe : Weekly
Central Patterns, the scanner specializing in chart patterns, did not identify any signals.
The presence of these Japanese chandelier patterns detected by Central Candlesticks that could impact the current short-term trend were also noted:
Bullish harami
Type : Bullish
Timeframe : Daily
Bullish harami cross
Type : Bullish
Timeframe : Daily
Doji
Type : Neutral
Timeframe : Daily
| S3 | S2 | S1 | Price | R1 | R2 | R3 | |
|---|---|---|---|---|---|---|---|
| ProTrendLines | 53,961.11 | 60,425.49 | 67,552.80 | 89,050.45 | 92,549.70 | 98,676.15 | 106,150.83 |
| Change (%) | -39.40% | -32.14% | -24.14% | - | +3.93% | +10.81% | +19.20% |
| Change | -35,089.34 | -28,624.96 | -21,497.65 | - | +3,499.25 | +9,625.70 | +17,100.38 |
| Level | Major | Intermediate | Major | - | Major | Intermediate | Major |
Attention could also be paid to pivot points to set price objectives:
| Pivot points | S3 | S2 | S1 | PP | R1 | R2 | R3 |
|---|---|---|---|---|---|---|---|
| Standard | 78,967.89 | 82,466.61 | 85,537.56 | 89,036.28 | 92,107.23 | 95,605.95 | 98,676.90 |
| Camarilla | 86,801.86 | 87,404.08 | 88,006.30 | 88,608.52 | 89,210.74 | 89,812.96 | 90,415.18 |
| Woodie | 78,754.02 | 82,359.67 | 85,323.69 | 88,929.34 | 91,893.36 | 95,499.01 | 98,463.03 |
| Fibonacci | 82,466.61 | 84,976.22 | 86,526.66 | 89,036.28 | 91,545.89 | 93,096.33 | 95,605.95 |
| Pivot points | S3 | S2 | S1 | PP | R1 | R2 | R3 |
|---|---|---|---|---|---|---|---|
| Standard | 87,312.39 | 90,338.38 | 93,458.68 | 96,484.67 | 99,604.97 | 102,630.96 | 105,751.26 |
| Camarilla | 94,888.76 | 95,452.17 | 96,015.58 | 96,578.99 | 97,142.40 | 97,705.81 | 98,269.22 |
| Woodie | 87,359.56 | 90,361.96 | 93,505.85 | 96,508.25 | 99,652.14 | 102,654.54 | 105,798.43 |
| Fibonacci | 90,338.38 | 92,686.26 | 94,136.78 | 96,484.67 | 98,832.55 | 100,283.07 | 102,630.96 |
| Pivot points | S3 | S2 | S1 | PP | R1 | R2 | R3 |
|---|---|---|---|---|---|---|---|
| Standard | 71,450.13 | 80,340.46 | 91,374.33 | 100,264.66 | 111,298.53 | 120,188.86 | 131,222.73 |
| Camarilla | 96,929.06 | 98,755.44 | 100,581.83 | 102,408.21 | 104,234.60 | 106,060.98 | 107,887.37 |
| Woodie | 72,521.91 | 80,876.35 | 92,446.11 | 100,800.55 | 112,370.31 | 120,724.75 | 132,294.51 |
| Fibonacci | 80,340.46 | 87,951.50 | 92,653.61 | 100,264.66 | 107,875.70 | 112,577.81 | 120,188.86 |
Numerical data
The following is the status of technical indicators and moving averages registered at the time this technical analysis was created:
| RSI (14): | 31.23 | |
| MACD (12,26,9): | -2,010.0100 | |
| Directional Movement: | -27.92 | |
| AROON (14): | -28.57 | |
| DEMA (21): | 93,003.80 | |
| Parabolic SAR (0,02-0,02-0,2): | 98,812.20 | |
| Elder Ray (13): | -5,608.68 | |
| Super Trend (3,10): | 97,967.91 | |
| Zig ZAG (10): | 89,005.84 | |
| VORTEX (21): | 0.8600 | |
| Stochastique (14,3,5): | 14.86 | |
| TEMA (21): | 91,533.78 | |
| Williams %R (14): | -77.13 | |
| Chande Momentum Oscillator (20): | -8,439.65 | |
| Repulse (5,40,3): | -4.0900 | |
| ROCnROLL: | 2 | |
| TRIX (15,9): | -0.1900 | |
| Courbe Coppock: | 7.85 |
| MA7: | 93,793.45 | |
| MA20: | 95,650.14 | |
| MA50: | 98,374.00 | |
| MA100: | 97,999.81 | |
| MAexp7: | 92,502.33 | |
| MAexp20: | 95,315.61 | |
| MAexp50: | 96,781.07 | |
| MAexp100: | 93,879.02 | |
| Price / MA7: | -5.06% | |
| Price / MA20: | -6.90% | |
| Price / MA50: | -9.48% | |
| Price / MA100: | -9.13% | |
| Price / MAexp7: | -3.73% | |
| Price / MAexp20: | -6.57% | |
| Price / MAexp50: | -7.99% | |
| Price / MAexp100: | -5.14% |
About author

Online


Add a comment
Comments
0 comments on the analysis BITCOIN - BTC/USD - Daily