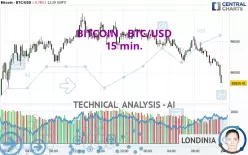
BITCOIN - BTC/USD - 15 min. - Technical analysis published on 02/23/2025 (GMT)
- 115
- 0
- Who voted?
Click here for a new analysis!
- Timeframe : 15 min.
- - Analysis generated on
- Status : LEVEL MAINTAINED

Summary of the analysis

Additional analysis
Quotes
BITCOIN - BTC/USD rating 95,826.40 USD. The price is lower by -0.78% since the last closing and was traded between 95,824.81 USD and 96,673.94 USD over the period. The price is currently at +0.00% from its lowest and -0.88% from its highest.The Central Gaps scanner detects a bullish opening marking the presence of buyers ahead of sellers at the opening but not sufficiently marked to allow the price to register a quotation gap.
Bullish opening
Type : Bullish
Timeframe : Openning
So that you have an overall view of the price change, here is a table showing the variations over several periods:
Near a new LOW record (1 month)
Type : Bearish
Timeframe : Weekly
Technical
A technical analysis in 15 min. of this BITCOIN - BTC/USD chart shows a sharp bearish trend. 92.86% of the signals given by moving averages are bearish. The overall trend is supported by the strong bearish signals from short-term moving averages. The Central Indicators market scanner currently does not detect any result that concerns moving averages.
In fact, according to the parameters integrated into the Central Analyzer system, only 9 technical indicators out of 18 analysed are currently bearish. Caution: the Central Indicators scanner currently detects an excess:
CCI indicator is oversold : under -100
Type : Neutral
Timeframe : 15 minutes
CCI indicator: bullish divergence
Type : Bullish
Timeframe : 15 minutes
Williams %R indicator is oversold : under -80
Type : Neutral
Timeframe : 15 minutes
Pivot points : price is under support 3
Type : Neutral
Timeframe : 15 minutes
Price is back under the pivot point
Type : Bearish
Timeframe : Weekly
An analysis of the price chart with the Central Patterns scanner (detector of chart patterns and resistances and supports) shows a result that can have an impact on the price change:
Horizontal support is broken
Type : Bearish
Timeframe : 15 minutes
For a small rebound in the very short term, the Central Candlesticks scanner currently notes the presence of this bullish pattern in Japanese candlesticks:
Bullish harami
Type : Bullish
Timeframe : 15 minutes
| S3 | S2 | S1 | Price | R1 | R2 | R3 | |
|---|---|---|---|---|---|---|---|
| ProTrendLines | 92,549.70 | 93,364.36 | 94,799.63 | 95,826.40 | 95,867.20 | 96,706.12 | 97,954.89 |
| Change (%) | -3.42% | -2.57% | -1.07% | - | +0.04% | +0.92% | +2.22% |
| Change | -3,276.70 | -2,462.04 | -1,026.77 | - | +40.80 | +879.72 | +2,128.49 |
| Level | Intermediate | Intermediate | Intermediate | - | Minor | Intermediate | Minor |
Attention could also be paid to pivot points to set price objectives:
| Pivot points | S3 | S2 | S1 | PP | R1 | R2 | R3 |
|---|---|---|---|---|---|---|---|
| Standard | 94,740.31 | 95,257.63 | 95,918.31 | 96,435.63 | 97,096.31 | 97,613.63 | 98,274.31 |
| Camarilla | 96,255.04 | 96,363.02 | 96,471.01 | 96,578.99 | 96,686.97 | 96,794.96 | 96,902.94 |
| Woodie | 94,811.99 | 95,293.47 | 95,989.99 | 96,471.47 | 97,167.99 | 97,649.47 | 98,345.99 |
| Fibonacci | 95,257.63 | 95,707.63 | 95,985.63 | 96,435.63 | 96,885.63 | 97,163.63 | 97,613.63 |
| Pivot points | S3 | S2 | S1 | PP | R1 | R2 | R3 |
|---|---|---|---|---|---|---|---|
| Standard | 87,312.39 | 90,338.38 | 93,458.68 | 96,484.67 | 99,604.97 | 102,630.96 | 105,751.26 |
| Camarilla | 94,888.76 | 95,452.17 | 96,015.58 | 96,578.99 | 97,142.40 | 97,705.81 | 98,269.22 |
| Woodie | 87,359.56 | 90,361.96 | 93,505.85 | 96,508.25 | 99,652.14 | 102,654.54 | 105,798.43 |
| Fibonacci | 90,338.38 | 92,686.26 | 94,136.78 | 96,484.67 | 98,832.55 | 100,283.07 | 102,630.96 |
| Pivot points | S3 | S2 | S1 | PP | R1 | R2 | R3 |
|---|---|---|---|---|---|---|---|
| Standard | 71,450.13 | 80,340.46 | 91,374.33 | 100,264.66 | 111,298.53 | 120,188.86 | 131,222.73 |
| Camarilla | 96,929.06 | 98,755.44 | 100,581.83 | 102,408.21 | 104,234.60 | 106,060.98 | 107,887.37 |
| Woodie | 72,521.91 | 80,876.35 | 92,446.11 | 100,800.55 | 112,370.31 | 120,724.75 | 132,294.51 |
| Fibonacci | 80,340.46 | 87,951.50 | 92,653.61 | 100,264.66 | 107,875.70 | 112,577.81 | 120,188.86 |
Numerical data
The following is the status of the technical indicators and moving averages at the time of publication of this technical analysis:
| RSI (14): | 33.64 | |
| MACD (12,26,9): | -76.4000 | |
| Directional Movement: | -14.60 | |
| AROON (14): | -50.00 | |
| DEMA (21): | 96,160.10 | |
| Parabolic SAR (0,02-0,02-0,2): | 96,336.37 | |
| Elder Ray (13): | -100.51 | |
| Super Trend (3,10): | 96,351.06 | |
| Zig ZAG (10): | 96,092.33 | |
| VORTEX (21): | 0.8700 | |
| Stochastique (14,3,5): | 10.95 | |
| TEMA (21): | 96,132.79 | |
| Williams %R (14): | -90.23 | |
| Chande Momentum Oscillator (20): | -212.41 | |
| Repulse (5,40,3): | -0.0200 | |
| ROCnROLL: | 2 | |
| TRIX (15,9): | -0.0100 | |
| Courbe Coppock: | 0.50 |
| MA7: | 96,463.78 | |
| MA20: | 96,734.34 | |
| MA50: | 98,938.77 | |
| MA100: | 98,016.92 | |
| MAexp7: | 96,174.10 | |
| MAexp20: | 96,257.07 | |
| MAexp50: | 96,363.50 | |
| MAexp100: | 96,488.75 | |
| Price / MA7: | -0.66% | |
| Price / MA20: | -0.94% | |
| Price / MA50: | -3.15% | |
| Price / MA100: | -2.23% | |
| Price / MAexp7: | -0.36% | |
| Price / MAexp20: | -0.45% | |
| Price / MAexp50: | -0.56% | |
| Price / MAexp100: | -0.69% |
About author

Online


Add a comment
Comments
0 comments on the analysis BITCOIN - BTC/USD - 15 min.