BITCOIN - BTC/USD - 1H - Technical analysis published on 02/04/2025 (GMT)
- 54
- 0
- Who voted?
- Timeframe : 1H
- - Analysis generated on
- Status : IN PROGRESS...
Summary of the analysis

Additional analysis
Quotes
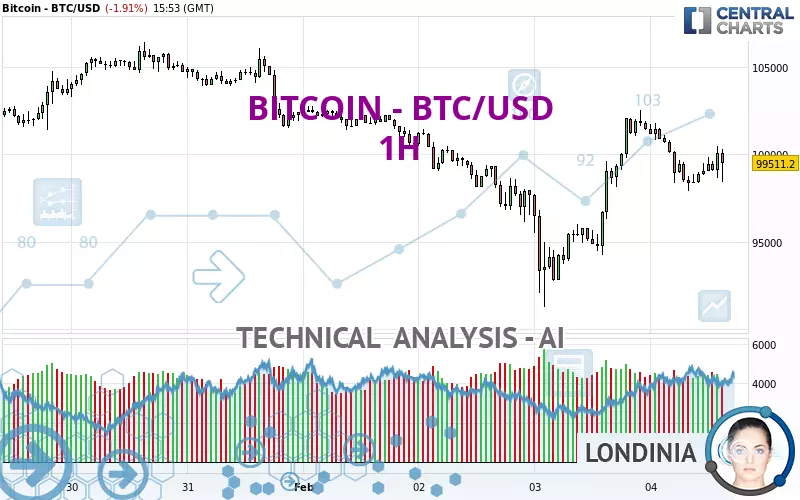
The BITCOIN - BTC/USD rating is 99,511.19 USD. The price registered a decrease of -1.91% on the session and was traded between 97,928.70 USD and 101,788.97 USD over the period. The price is currently at +1.62% from its lowest and -2.24% from its highest.The Central Gaps scanner detects a bullish opening. A small advantage for buyers in the very short term.
Bullish opening
Type : Bullish
Timeframe : Openning
Here is a more detailed summary of the historical variations registered by BITCOIN - BTC/USD:
Technical
Technical analysis of BITCOIN - BTC/USD in 1H shows an overall slightly bullish trend. 53.57% of the signals given by moving averages are bullish. The overall trend remains fragile, as do the slightly bullish signals given by short-term moving averages. The Central Indicators scanner detects bullish and bearish signals on moving averages that could impact this trend:
Bullish trend reversal : adaptative moving average 100
Type : Bullish
Timeframe : 1 hour
Bearish price crossover with Moving Average 100
Type : Bearish
Timeframe : 1 hour
Bearish price crossover with adaptative moving average 20
Type : Bearish
Timeframe : 1 hour
On the 18 technical indicators analysed, 5 are bullish, 8 are neutral and 5 are bearish. Other results related to technical indicators were also found by the Central Indicators scanner:
RSI indicator is back under 50
Type : Bearish
Timeframe : 1 hour
Williams %R indicator is back under -50
Type : Bearish
Timeframe : 1 hour
No signals are given by Central Patterns, a market scanner specialised in chart patterns, resistances and supports.
For a small setback in the very short term, the Central Candlesticks scanner currently notes the presence of this bearish pattern in Japanese candlesticks:
Bearish engulfing lines
Type : Bearish
Timeframe : 1 hour
| S3 | S2 | S1 | Price | R1 | R2 | R3 | |
|---|---|---|---|---|---|---|---|
| ProTrendLines | 94,237.73 | 96,025.03 | 99,125.21 | 99,511.19 | 101,446.71 | 103,791.00 | 106,144.09 |
| Change (%) | -5.30% | -3.50% | -0.39% | - | +1.95% | +4.30% | +6.67% |
| Change | -5,273.46 | -3,486.16 | -385.98 | - | +1,935.52 | +4,279.81 | +6,632.90 |
| Level | Intermediate | Intermediate | Intermediate | - | Intermediate | Intermediate | Major |
To determine price objectives, it is also possible to use the pivot points. Here is the price position in relation to pivot points:
| Pivot points | S3 | S2 | S1 | PP | R1 | R2 | R3 |
|---|---|---|---|---|---|---|---|
| Standard | 82,996.93 | 87,127.15 | 94,288.86 | 98,419.08 | 105,580.79 | 109,711.01 | 116,872.72 |
| Camarilla | 98,345.29 | 99,380.38 | 100,415.48 | 101,450.57 | 102,485.66 | 103,520.76 | 104,555.85 |
| Woodie | 84,512.68 | 87,885.02 | 95,804.61 | 99,176.95 | 107,096.54 | 110,468.88 | 118,388.47 |
| Fibonacci | 87,127.15 | 91,440.67 | 94,105.56 | 98,419.08 | 102,732.60 | 105,397.49 | 109,711.01 |
| Pivot points | S3 | S2 | S1 | PP | R1 | R2 | R3 |
|---|---|---|---|---|---|---|---|
| Standard | 87,989.71 | 92,847.36 | 96,733.68 | 101,591.33 | 105,477.65 | 110,335.30 | 114,221.62 |
| Camarilla | 98,215.40 | 99,016.93 | 99,818.46 | 100,619.99 | 101,421.52 | 102,223.05 | 103,024.58 |
| Woodie | 87,504.04 | 92,604.53 | 96,248.01 | 101,348.50 | 104,991.98 | 110,092.47 | 113,735.95 |
| Fibonacci | 92,847.36 | 96,187.56 | 98,251.14 | 101,591.33 | 104,931.53 | 106,995.11 | 110,335.30 |
| Pivot points | S3 | S2 | S1 | PP | R1 | R2 | R3 |
|---|---|---|---|---|---|---|---|
| Standard | 71,450.13 | 80,340.46 | 91,374.33 | 100,264.66 | 111,298.53 | 120,188.86 | 131,222.73 |
| Camarilla | 96,929.06 | 98,755.44 | 100,581.83 | 102,408.21 | 104,234.60 | 106,060.98 | 107,887.37 |
| Woodie | 72,521.91 | 80,876.35 | 92,446.11 | 100,800.55 | 112,370.31 | 120,724.75 | 132,294.51 |
| Fibonacci | 80,340.46 | 87,951.50 | 92,653.61 | 100,264.66 | 107,875.70 | 112,577.81 | 120,188.86 |
Numerical data
The following is the status of technical indicators and moving averages registered at the time this technical analysis was created:
| RSI (14): | 54.83 | |
| MACD (12,26,9): | 248.7000 | |
| Directional Movement: | 3.58 | |
| AROON (14): | -50.00 | |
| DEMA (21): | 99,688.69 | |
| Parabolic SAR (0,02-0,02-0,2): | 97,979.47 | |
| Elder Ray (13): | 332.41 | |
| Super Trend (3,10): | 97,968.19 | |
| Zig ZAG (10): | 98,757.23 | |
| VORTEX (21): | 0.9700 | |
| Stochastique (14,3,5): | 40.41 | |
| TEMA (21): | 99,503.42 | |
| Williams %R (14): | -70.19 | |
| Chande Momentum Oscillator (20): | -1,464.48 | |
| Repulse (5,40,3): | 0.1200 | |
| ROCnROLL: | 2 | |
| TRIX (15,9): | 0.0600 | |
| Courbe Coppock: | 4.01 |
| MA7: | 101,435.81 | |
| MA20: | 102,591.99 | |
| MA50: | 99,016.87 | |
| MA100: | 94,275.68 | |
| MAexp7: | 99,383.25 | |
| MAexp20: | 99,334.36 | |
| MAexp50: | 99,101.17 | |
| MAexp100: | 99,814.34 | |
| Price / MA7: | -1.90% | |
| Price / MA20: | -3.00% | |
| Price / MA50: | +0.50% | |
| Price / MA100: | +5.55% | |
| Price / MAexp7: | +0.13% | |
| Price / MAexp20: | +0.18% | |
| Price / MAexp50: | +0.41% | |
| Price / MAexp100: | -0.30% |
About author

Online


Add a comment
Comments
0 comments on the analysis BITCOIN - BTC/USD - 1H