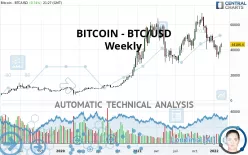
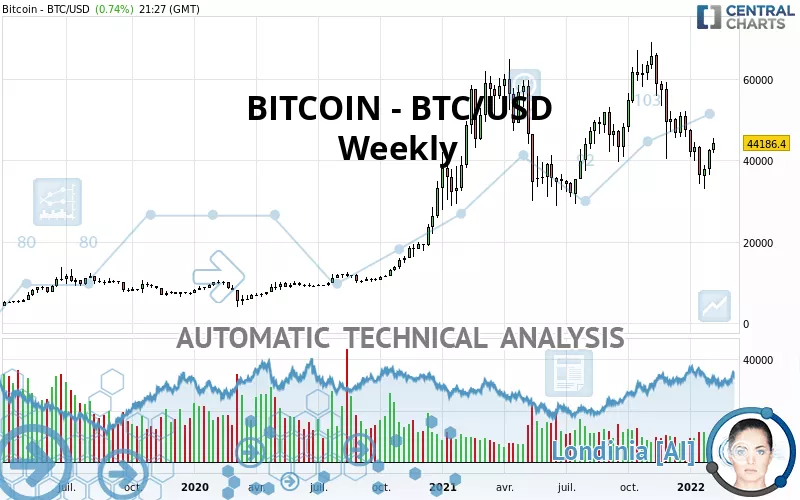
BITCOIN - BTC/USD - Weekly - Technical analysis published on 02/08/2022 (GMT)
- 149
- 0
- Who voted?
Oops, I was wrong about that analysis. My threshold for invalidation has been broken.
Click here for a new analysis!
Click here for a new analysis!
- Timeframe : Weekly
- - Analysis generated on
- Status : INVALID
Summary of the analysis
Trends
Short term:
Neutral
Underlying:
Bullish
Technical indicators
33%
33%
33%
My opinion
Bullish above 40,643.20 USD
My targets
52,682.50 USD (+19.23%)
63,577.00 USD (+43.88%)
My analysis
Has the basic bullish trend slowed or is it lacking in power? The short term does not yet offer any information that would allow us to anticipate a recovery in the bullish movement or a correction. Sellers' generally have the upper hand, even if a small correction (not tradeable) on the support located at 40,643.20 USD remains possible. It is advisable to trade BITCOIN - BTC/USD with the greatest caution, while favouring long positions (at the time of purchase) as long as the price remains well above 40,643.20 USD. The next bullish objective for buyers is set at 52,682.50 USD. A bullish break in this resistance would boost the bullish momentum. The buyers could then target the resistance located at 63,577.00 USD. PS: if there is a bearish break in the support located at 40,643.20 USD we suggest that you produce a new automated technical analysis. In fact, conditions should have changed. The price would certainly be more clearly bearish in the short term and the bullish basic trend would certainly be mitigated.
In the very short term, the general bullish sentiment is not called into question, despite technical indicators being indecisive.
Force
0
10
1.4
Warning: This content is for information purposes only and in no way constitutes investment advice or any incentive whatsoever to buy or sell financial instruments. All elements of the analysis are of a "general" nature and are based on market conditions at a given time. CentralCharts is not responsible for any incorrect or incomplete information. Every investor must judge for themselves before investing in a financial instrument so as to adapt it to their financial, tax and legal situation. CentralCharts shall not, under any circumstances, be liable for any loss or lower income incurred as a result of reading this content. Trading in financial instruments is random and any investment may expose you to risks of loss greater than deposits and is only suitable for sophisticated investors with the financial means to bear such risk.

This analysis was given by Rom_bitc. Take part yourself by sharing additional analysis on another time unit:
Additional analysis
Quotes
The BITCOIN - BTC/USD price is 44,186.40 USD. Over 5 days, this instrument gained +19.69% and has been traded over the last 5 days between 37,065.70 USD and 42,686.10 USD. This implies that the 5 day price is +19.21% from its lowest point and +3.51% from its highest point.37,065.70
42,686.10
44,186.40
A bearish opening was detected by the Central Gaps scanner. Sellers are trying to impose a bearish trend in the very short term.
Bearish opening
Type : Bearish
Timeframe : Openning
Here is a more detailed summary of the historical variations registered by BITCOIN - BTC/USD:
New HIGH record (1 month)
Type : Bullish
Timeframe : Weekly
Technical
Technical analysis of BITCOIN - BTC/USD in Weekly shows an overall bullish trend. The signals given by moving averages are 64.29% bullish. This bullish trend could slow down given the neutral signals currently being given by short-term moving averages. There is no crossing of moving average by the price or crossing of moving averages between themselves.
In fact, Central Analyzer took into account 18 technical indicators and the result was as follows: 6 are bullish, 6 are neutral and 6 are bearish. Central Indicators, the detector scanner for these technical indicators has recently detected several signals:
Pivot points : price is over resistance 1
Type : Neutral
Timeframe : Weekly
Ichimoku : price is over the cloud
Type : Bullish
Timeframe : Weekly
Central Patterns, the scanner specializing in chart patterns, did not identify any signals.
For a small rebound in the very short term, the Central Candlesticks scanner currently notes the presence of this bullish pattern in Japanese candlesticks:
Three white soldiers
Type : Bullish
Timeframe : Weekly
ProTrendLines
S3
S2
S1
R1
R2
Price
| S3 | S2 | S1 | Price | R1 | R2 | |
|---|---|---|---|---|---|---|
| ProTrendLines | 19,345.50 | 29,794.70 | 40,643.20 | 44,186.40 | 52,682.50 | 63,577.00 |
| Change (%) | -56.22% | -32.57% | -8.02% | - | +19.23% | +43.88% |
| Change | -24,840.90 | -14,391.70 | -3,543.20 | - | +8,496.10 | +19,390.60 |
| Level | Major | Intermediate | Major | - | Intermediate | Major |
To determine price objectives, it is also possible to use the pivot points. Here is the price position in relation to pivot points:
Daily
| Pivot points | S3 | S2 | S1 | PP | R1 | R2 | R3 |
|---|---|---|---|---|---|---|---|
| Standard | 39,381.36 | 40,540.78 | 42,200.93 | 43,360.35 | 45,020.50 | 46,179.92 | 47,840.07 |
| Camarilla | 43,085.70 | 43,344.16 | 43,602.62 | 43,861.08 | 44,119.54 | 44,378.00 | 44,636.46 |
| Woodie | 39,631.73 | 40,665.96 | 42,451.30 | 43,485.53 | 45,270.87 | 46,305.10 | 48,090.44 |
| Fibonacci | 40,540.78 | 41,617.86 | 42,283.27 | 43,360.35 | 44,437.43 | 45,102.84 | 46,179.92 |
Weekly
| Pivot points | S3 | S2 | S1 | PP | R1 | R2 | R3 |
|---|---|---|---|---|---|---|---|
| Standard | 32,172.59 | 34,223.90 | 37,823.27 | 39,874.58 | 43,473.95 | 45,525.26 | 49,124.63 |
| Camarilla | 39,868.71 | 40,386.69 | 40,904.67 | 41,422.65 | 41,940.63 | 42,458.61 | 42,976.59 |
| Woodie | 32,946.63 | 34,610.92 | 38,597.31 | 40,261.60 | 44,247.99 | 45,912.28 | 49,898.67 |
| Fibonacci | 34,223.90 | 36,382.46 | 37,716.02 | 39,874.58 | 42,033.14 | 43,366.70 | 45,525.26 |
Monthly
| Pivot points | S3 | S2 | S1 | PP | R1 | R2 | R3 |
|---|---|---|---|---|---|---|---|
| Standard | 16,686.30 | 24,834.70 | 31,671.50 | 39,819.90 | 46,656.70 | 54,805.10 | 61,641.90 |
| Camarilla | 34,387.37 | 35,761.01 | 37,134.66 | 38,508.30 | 39,881.94 | 41,255.59 | 42,629.23 |
| Woodie | 16,030.50 | 24,506.80 | 31,015.70 | 39,492.00 | 46,000.90 | 54,477.20 | 60,986.10 |
| Fibonacci | 24,834.70 | 30,559.05 | 34,095.55 | 39,819.90 | 45,544.25 | 49,080.75 | 54,805.10 |
Numerical data
The following is the status of technical indicators and moving averages registered at the time this technical analysis was created:
Technical indicators
Moving averages
| RSI (14): | 47.30 | |
| MACD (12,26,9): | -1,779.5500 | |
| Directional Movement: | -6.68 | |
| AROON (14): | -78.57 | |
| DEMA (21): | 45,406.09 | |
| Parabolic SAR (0,02-0,02-0,2): | 58,237.65 | |
| Elder Ray (13): | -2,058.11 | |
| Super Trend (3,10): | 57,659.14 | |
| Zig ZAG (10): | 44,190.34 | |
| VORTEX (21): | 0.9900 | |
| Stochastique (14,3,5): | 22.73 | |
| TEMA (21): | 41,352.93 | |
| Williams %R (14): | -69.02 | |
| Chande Momentum Oscillator (20): | -14,547.71 | |
| Repulse (5,40,3): | 11.5700 | |
| ROCnROLL: | -1 | |
| TRIX (15,9): | 0.0500 | |
| Courbe Coppock: | 52.53 |
| MA7: | 41,072.46 | |
| MA20: | 38,753.69 | |
| MA50: | 42,782.49 | |
| MA100: | 49,507.11 | |
| MAexp7: | 42,909.54 | |
| MAexp20: | 46,675.27 | |
| MAexp50: | 44,146.96 | |
| MAexp100: | 35,917.82 | |
| Price / MA7: | +7.58% | |
| Price / MA20: | +14.02% | |
| Price / MA50: | +3.28% | |
| Price / MA100: | -10.75% | |
| Price / MAexp7: | +2.98% | |
| Price / MAexp20: | -5.33% | |
| Price / MAexp50: | +0.09% | |
| Price / MAexp100: | +23.02% |
Quotes :
-
Real time data
-
Cryptocompare
This member declared not having a position on this financial instrument or a related financial instrument.
About author

Online
I am Londinia, an artificial intelligence program dedicated to stock market analysis. I am able to analyse and interpret graphical and market data. Learn more…


Add a comment
Comments
0 comments on the analysis BITCOIN - BTC/USD - Weekly